Comparing Cloud Providers
|
This content was generated with the assistance of AI and should be verified against the official documentation before being relied on in production. See the bibliographies of the Azure, AWS and Google Cloud sections for the reference material consulted while preparing these pages. |
This page compares the three public cloud providers documented in this section, AWS, Azure and Google Cloud, on popularity, ecosystem, learning curve, pricing, availability regions and a few other metrics. It ends with a recommendation by workload type and target region, plus a decision flowchart. All figures are a snapshot as of 2026-10-26: each number is linked to a source listed in the Bibliography, and the data files behind the tables and figures are kept in the repository under scripts/cloud-comparison-charts/data.
The scope is deliberately limited to the three providers above. Other providers, such as Oracle Cloud Infrastructure, Alibaba Cloud and IBM Cloud, exist and matter in some markets, but they are mentioned for context only and are not scored. The Gartner positioning in Analyst positioning notes, for example, that Alibaba Cloud was also named a Leader in 2026.
Methodology
Sources, dates and missing data
Every row of every data file has a source id and a retrieval date (2026-10-26, the snapshot date). Primary and official sources are preferred: the providers' earnings releases, official pricing pages and price-list files, official region and service-availability pages, SLA documents, and recognised analyst and survey publications. Source ids appear next to each table or figure as links into the Bibliography, which lists every source with its publication or access date. Blogs and unsourced aggregators are not used for numbers.
A value for which no reliable public source was found is shown as n/a (not available). It is never plotted as zero and never estimated. Where a figure had to come from a secondary source because the primary page could not be read, it is labelled as secondary in the text:
-
JetBrains State of Developer Ecosystem 2025 is taken from an AWS Insider report, because the JetBrains page returned an access error.
-
Stack Overflow Developer Survey 2026 usage, admired and desired figures are taken from a Virtualization Review article dated 2026-10-06, because the survey page text had no per-provider figures.
-
Canalys (Omdia) quarterly shares come from search-engine excerpts of the publisher pages, which returned an access error when fetched, so some provider shares are missing.
-
Gartner Magic Quadrant positioning for 2020 to 2022 comes from press coverage, and the 2025 and 2026 positioning of AWS and Google Cloud comes from the providers' own statements. The Gartner reports themselves are not public.
Caveats that apply to the whole page
-
Synergy Research Group and Canalys (Omdia) market-share series are different series with different scopes and methods and must not be spliced together.
-
Synergy changed its treatment of Microsoft from the third quarter of 2024: some Azure revenue was reclassified as software as a service, which lowered Microsoft’s share from that release onward. The share series has a break at that point.
-
Revenue segments are not like for like: AWS reports segment net sales, Google Cloud reports a segment that includes Google Workspace, Microsoft reports Intelligent Cloud, which is broader than Azure, and discloses Azure only as a growth rate.
-
Developer surveys measure different populations and wordings, so their percentages are not comparable across surveys.
-
A region or an availability zone is not defined identically by the three providers, and the Azure count used here is the number of regions listed on the Microsoft regions page, which may include regions that are not open to every customer.
-
Prices are list prices on the retrieval date, on demand, in US dollars, without taxes, discounts, free allowances or support plans. They are not a quote.
Criteria and score derivation
The radar chart in Scorecard uses six axes scored from 0 to 10, where 10 means best of the three providers on that axis (not a theoretical maximum). Four axes are computed from the data files by a script, and two are editorial. The rule for each axis is:
| Axis | Kind | Rule |
|---|---|---|
Popularity |
Computed |
10 times the mean of (Synergy 2026-Q2 share divided by the largest share) and (Stack Overflow 2026 usage divided by the largest usage) |
Ecosystem breadth |
Computed |
10 times the mean of (service categories with a service, out of the 31 mapped) and (official SDK languages divided by the largest count) |
Ease of use |
Editorial |
Judgement from trial credit and length, Stack Overflow admired score, size of the first-party learning catalogue and certification path size |
Price competitiveness |
Computed |
10 times the mean over the four reference architectures of (cheapest monthly list-price total divided by own total) |
Regional coverage |
Computed |
10 times the mean of (generally available public regions divided by the most), (their availability zones divided by the most) and (sovereign categories available out of China, government and sovereign, divided by 3). Region and zone counts come from the footprint data on the same basis for all three providers: China, government and sovereign partitions are left out of the counts, because they are scored by the third term |
AI offering |
Editorial, low confidence |
Judgement from managed ML platform, foundation-model platform, prebuilt AI services and AI certifications; no model-quality or market data was fetched |
The scores, the evidence behind each one and the computed-versus-editorial split are given in Scorecard. The data
files and their refresh procedure are documented in the repository (scripts/cloud-comparison-charts/data/NOTES.md),
and the figures are regenerated from them with npm run charts:cloud-comparison.
Snapshot date and where to check current values
All values are stated as of 2026-10-26 unless a table says otherwise. Cloud pricing, regions and service availability change continuously, so check the live official pages before making a decision:
| Metric | Where to check current values |
|---|---|
Regions and zones |
AWS Global Infrastructure; Google Cloud locations; Azure products by region |
Per-region services and AI models |
AWS Regional Services List; Azure products available by region; Vertex AI locations |
Pricing |
Azure Retail Prices API; Google Cloud compute pricing; AWS price-list files such as the Amazon EC2 price list |
Free tiers |
AWS Free Tier; Azure free account; Google Cloud Free Program |
Market share |
The latest quarterly press releases of Synergy Research Group and Omdia (Canalys), listed in the Bibliography |
Revenue |
The latest earnings releases of Amazon, Alphabet and Microsoft, listed in the Bibliography |
Service-level agreements |
Popularity
Market share
Synergy Research Group publishes a quarterly estimate of worldwide spending on cloud infrastructure services (IaaS, PaaS and hosted private cloud) and each provider’s share of it. In the second quarter of 2026 the total was about USD 143.4 billion, with AWS at 28%, Microsoft at 20% and Google Cloud at 15%. Synergy reports Microsoft as a whole (Azure and related infrastructure and platform services), not Azure alone.

| Quarter | AWS | Azure (Microsoft) | Google Cloud | Market, USD billion |
|---|---|---|---|---|
2018-Q3 |
34% |
n/a |
n/a |
17.0 |
2020-Q4 |
n/a |
20% |
n/a |
37.1 |
2022-Q4 |
n/a |
23% |
11% |
61.6 |
2023-Q4 |
31% |
24% |
11% |
73.7 |
2024-Q2 |
32% |
23% |
12% |
79.1 |
2024-Q3 |
31% |
20% |
13% |
83.8 |
2025-Q4 |
28% |
21% |
14% |
119.1 |
2026-Q2 |
28% |
20% |
15% |
143.4 |
Synergy shares for selected quarters; n/a means the press release did not state a number for that provider. The 2018-Q3 total is a lower bound (Synergy wrote "well over $17 billion"). Microsoft’s share before 2024-Q3 is not comparable with later quarters because of the reclassification described in Methodology. Sources: srg-2018-q3, srg-2020-q4, srg-2022-q4, srg-2023-q4, srg-2024-q2, srg-2024-q3, srg-2025-q4, srg-2026-q2. The other quarters plotted are in the Bibliography.
Canalys, now part of Omdia, publishes a separate series. Its public excerpts give only some provider shares, so the chart below has gaps that are real gaps in the source and not zeros.

| Quarter | AWS | Azure | Google Cloud | Market, USD billion |
|---|---|---|---|---|
2024-Q4 |
n/a |
n/a |
n/a |
86.0 |
2025-Q1 |
32% |
23% |
10% |
n/a |
2025-Q3 |
32% |
n/a |
n/a |
102.6 |
2025-Q4 |
32% |
22% |
12% |
110.9 |
Canalys (Omdia) shares. The fourth quarter of 2025 growth rates reported were AWS 24%, Azure 39% and Google Cloud 50%. Figures come from search-engine excerpts, a secondary route, because the publisher pages could not be fetched. Sources: canalys-2024-q4, omdia-2025-q1, omdia-2025-q3, omdia-2025-q4. The Synergy and Canalys series differ in definition, so for example AWS is at 28% in Synergy and 32% in Omdia in the fourth quarter of 2025.
Revenue
Revenue comes from the providers' own earnings releases, shown here by calendar quarter (Microsoft’s fiscal quarters are mapped to the calendar quarter they end in). The three reported figures are not directly comparable. Amazon reports AWS segment net sales. Alphabet reports a Google Cloud segment that includes Google Workspace as well as Google Cloud Platform. Microsoft reports an Intelligent Cloud segment that is broader than Azure and does not disclose Azure revenue in dollars, only its year-over-year growth rate (and, for the fiscal year 2026, that Azure passed USD 100 billion of annual revenue). Microsoft changed its segment definitions from fiscal 2025, so only the current definition is shown.


| Quarter | Segment | Revenue, USD million | Operating income, USD million | Growth year over year |
|---|---|---|---|---|
2024-Q2 |
AWS segment net sales |
26,281 |
9,334 |
18.7% |
2024-Q2 |
Google Cloud segment revenues |
10,347 |
1,172 |
28.8% |
2024-Q2 |
Microsoft Intelligent Cloud segment |
23,785 |
n/a |
n/a |
2024-Q2 |
Azure and other cloud services |
not disclosed |
n/a |
29% (constant currency 30%) |
2025-Q2 |
AWS segment net sales |
30,873 |
10,160 |
17.5% |
2025-Q2 |
Google Cloud segment revenues |
13,624 |
2,826 |
31.7% |
2025-Q2 |
Microsoft Intelligent Cloud segment |
29,878 |
n/a |
25.6% |
2025-Q2 |
Azure and other cloud services |
not disclosed |
n/a |
39% (constant currency 39%) |
2026-Q2 |
AWS segment net sales |
42,232 |
16,621 |
36.8% |
2026-Q2 |
Google Cloud segment revenues |
24,768 |
8,814 |
81.8% |
2026-Q2 |
Microsoft Intelligent Cloud segment |
39,306 |
n/a |
31.6% |
2026-Q2 |
Azure and other cloud services |
not disclosed |
n/a |
43% |
Selected quarters. Microsoft does not report operating income for Intelligent Cloud in this dataset, and Azure revenue is not disclosed. Sources: amazon-q2-2024, amazon-q2-2025, amazon-q2-2026, alphabet-q2-2024, alphabet-q2-2025, alphabet-q2-2026, msft-fy24-q4, msft-fy25-q4, msft-fy26-q4; the other quarters plotted are in the Bibliography.
Adoption and developer usage
Surveys show what developers and IT teams report using, which is a different thing from spending. The Stack Overflow Developer Survey asks which cloud platforms respondents have used. Its results are shown for all respondents and for professional developers.


| Year | Population | AWS | Azure | Google Cloud |
|---|---|---|---|---|
2022 |
All respondents |
51.01% |
28.72% |
26.81% |
2022 |
Professional developers |
55.17% |
30.36% |
26.1% |
2023 |
All respondents |
48.62% |
26.03% |
23.86% |
2023 |
Professional developers |
53.08% |
27.8% |
23.95% |
2024 |
All respondents |
48% |
27.8% |
25.1% |
2024 |
Professional developers |
52.2% |
29.7% |
24.9% |
2025 |
All respondents |
43.3% |
26.3% |
24.6% |
2025 |
Professional developers |
45.9% |
27.2% |
24.3% |
2026 (secondary source) |
Cloud development question, 10,889 responses |
41.8% |
25.1% |
24.5% |
Stack Overflow Developer Survey, cloud platforms used. The question wording may differ between years. The 2026 row comes from a Virtualization Review article reporting the 2026 survey (secondary source, article dated 2026-10-06). Sources: so-survey-2022, so-survey-2023, so-survey-2024, so-survey-2025, so-2026-vr.
Other surveys measure other populations. Flexera’s State of the Cloud reports the share of respondents running workloads on each provider, JetBrains asks developers which cloud platform they use, and the CNCF annual survey is about cloud native technology adoption.

| Survey and metric | Year | Population (sample) | AWS | Azure | Google Cloud |
|---|---|---|---|---|---|
Flexera: running significant workloads |
2025 |
IT professionals and executives, global (759) |
53% |
29% |
16% |
Flexera: running active workloads |
2026 |
Cloud decision-makers and users, global (753) |
83% |
79% |
n/a |
JetBrains: cloud platform used (secondary source) |
2025 |
Developers, April to June 2025 (24,534) |
43% |
22% |
22% |
CNCF annual survey: cloud provider usage |
2024, 2025 |
Cloud native community |
n/a |
n/a |
n/a |
The Flexera 2026 press release did not give a Google Cloud percentage. The CNCF report summary pages carry no per-provider usage statistic, and the full report was not read, so no value is given. The Flexera and JetBrains questions are not like for like. Sources: flexera-2025-blog, flexera-2026-press, jetbrains-2025-awsinsider, cncf-survey-2024, cncf-survey-2025.
Analyst positioning
Gartner publishes a Magic Quadrant for cloud infrastructure and platform services each year (renamed Strategic Cloud Platform Services from 2024). The reports are gated, so positioning here comes from press coverage for 2020 to 2022 and from the providers' own statements for 2024 to 2026. Where no retrieved source confirmed a placement, the cell says so rather than assuming one.
| Year | Report | AWS | Azure | Google Cloud |
|---|---|---|---|---|
2020 |
Cloud Infrastructure and Platform Services |
Leader |
Leader |
Leader |
2021 |
Cloud Infrastructure and Platform Services |
Leader |
Leader |
Leader |
2022 |
Cloud Infrastructure and Platform Services |
Leader |
Leader |
Leader |
2024 |
Strategic Cloud Platform Services |
n/a (not retrieved) |
Leader |
n/a (not retrieved) |
2025 |
Strategic Cloud Platform Services |
Leader |
n/a (not confirmed) |
Leader |
2026 |
Strategic Cloud Platform Services |
Leader |
n/a (not confirmed) |
Leader |
AWS states that it placed highest on Ability to Execute in 2025 and 2026 and was named a Leader for the fifteenth and sixteenth consecutive years. Alibaba Cloud was also named a Leader for the first time in 2026, according to the same AWS statement. Microsoft is covered in the 2026 report according to the Gartner abstract, but its quadrant could not be confirmed from any retrieved source. Sources: gartner-mq-2020-sdx, gartner-mq-2021-vr, gartner-mq-2022-sdx, gartner-mq-2024-azure, gartner-mq-2025-aws, gartner-mq-2025-google, gartner-mq-2026-aws, gartner-mq-2026-google. The 2020 to 2022 sources are press coverage.
Ecosystem
Service mapping
The providers' own cross-cloud comparison pages list equivalent services. An n/a below means that the sources used list no equivalent service on that provider, not that none exists: Google’s comparison page and Microsoft’s pages list no Google equivalent for several categories. In total, AWS has a mapped service in 31 of the 31 categories, Azure in 30 and Google Cloud in 24. This count is one of the two inputs of the ecosystem breadth score.
| Category | AWS | Azure | Google Cloud |
|---|---|---|---|
Virtual machines |
Amazon EC2 |
Azure Virtual Machines |
Compute Engine |
Kubernetes |
Amazon EKS |
Azure Kubernetes Service (AKS) |
Google Kubernetes Engine (GKE) |
Serverless functions |
AWS Lambda |
Azure Functions |
Cloud Run functions |
Serverless containers |
AWS Fargate; AWS App Runner |
Azure Container Apps; Azure Container Instances |
Cloud Run |
Web app platform (PaaS) |
AWS Elastic Beanstalk |
Azure App Service |
n/a |
Workflow orchestration |
AWS Step Functions |
Azure Durable Functions; Azure Logic Apps |
n/a |
Object storage |
Amazon S3 |
Azure Blob Storage |
Cloud Storage |
Block storage |
Amazon EBS |
Azure managed disks |
Google Cloud Hyperdisk |
File storage |
Amazon EFS |
Azure Files |
Filestore |
Managed relational database |
Amazon RDS; Amazon Aurora |
Azure SQL Database; Azure Database for MySQL; Azure Database for PostgreSQL |
Cloud SQL (AlloyDB and Spanner also listed by Google) |
Key-value / document NoSQL |
Amazon DynamoDB |
Azure Cosmos DB |
Bigtable |
In-memory cache |
Amazon ElastiCache |
Azure Managed Redis |
n/a |
Data warehouse |
Amazon Redshift |
Azure Synapse Analytics |
BigQuery |
Message queue |
Amazon SQS; Amazon SNS; Amazon EventBridge |
Azure Service Bus; Azure Queue Storage |
Cloud Tasks |
Pub/sub and streaming |
Amazon Kinesis Data Streams; Amazon MQ |
Azure Service Bus; Azure Event Hubs |
Pub/Sub |
Load balancing |
Elastic Load Balancing |
Azure Load Balancer |
Cloud Load Balancing |
DNS |
Amazon Route 53 |
Azure DNS |
Cloud DNS |
Content delivery network |
Amazon CloudFront |
Azure Front Door |
Cloud CDN |
VPN and private connectivity |
AWS VPN; AWS Direct Connect |
Azure VPN Gateway; Azure ExpressRoute |
Cloud VPN; Cloud Interconnect |
Identity and access |
AWS IAM; IAM Identity Center |
Microsoft Entra ID; Azure RBAC |
Cloud IAM; Cloud Identity |
Key management |
AWS KMS |
Azure Key Vault |
Cloud KMS |
Monitoring and logging |
Amazon CloudWatch |
Azure Monitor |
Cloud Monitoring |
CI/CD |
AWS CodeBuild; CodeDeploy; CodePipeline |
Azure DevOps; GitHub Actions |
Cloud Build |
Infrastructure as code |
AWS CloudFormation; AWS CDK |
Azure Resource Manager; Bicep |
Infrastructure Manager (Terraform-based); Config Connector |
Machine learning platform |
Amazon SageMaker |
Azure Machine Learning; Fabric Data Science |
Vertex AI |
Generative AI platform |
Amazon Bedrock |
Microsoft Foundry |
Vertex AI Studio; Vertex AI Model Garden |
Document and speech AI |
Amazon Textract; Polly; Transcribe |
Azure Document Intelligence; Speech |
n/a |
IoT device gateway |
AWS IoT Core |
Azure IoT Hub |
n/a |
Hybrid and edge |
AWS Outposts |
Azure Arc; Azure Local |
n/a |
Satellite ground stations |
AWS Ground Station |
None |
n/a |
Marketplace |
AWS Marketplace |
Microsoft Marketplace |
Google Cloud Marketplace |
Sources: svc-gcp-comparison, svc-ms-aws-index, svc-ms-compute, svc-ms-storage, svc-ms-databases, svc-ms-dataai, svc-gcp-infra-manager. The Azure row for ground stations reads None because Microsoft states that it has no managed ground station service.
Tooling and infrastructure as code
The table compares the official command-line tools, SDK coverage and infrastructure-as-code support. The Terraform provider rows are the cumulative downloads of the HashiCorp provider (hashicorp/aws, hashicorp/azurerm and hashicorp/google). The Python rows are the weekly downloads of boto3 (the whole AWS SDK), azure-storage-blob and google-cloud-storage, so the AWS number covers far more than storage and is not like for like. Azure counts mobile and embedded SDKs among its ten, and Google Cloud has no PowerShell module in the sources fetched. None of the three publishes a current official marketplace listing total, so that row is n/a; an older third-party figure for AWS was not used.
| Metric | AWS | Azure | Google Cloud |
|---|---|---|---|
Official SDK languages |
11 |
10 |
9 |
Command-line tool |
aws |
az |
gcloud |
PowerShell module |
yes |
yes |
n/a |
CLI repository stars on GitHub |
17,329 |
4,656 |
n/a |
Native infrastructure as code |
CloudFormation; CDK; SAM |
ARM templates; Bicep; Azure Developer CLI |
Infrastructure Manager (Terraform-based); Config Connector |
Terraform provider downloads (cumulative) |
8,140,257,875 |
2,078,987,403 |
2,698,001,274 |
Terraform provider stars on GitHub |
11,126 |
4,977 |
2,670 |
Pulumi provider stars on GitHub |
579 |
154 |
218 |
Python storage SDK downloads per week |
587,599,272 |
24,066,011 |
39,240,712 |
npm storage SDK downloads per week (week to 2026-07-01) |
31,893,939 |
7,812,545 |
12,968,233 |
Marketplace listings |
n/a |
n/a |
n/a |
Sources: sdkref-aws, azure-sdk-releases, gcp-client-libraries, github-api, terraform-registry, pypistats, npm-downloads, svc-ms-aws-index, svc-gcp-infra-manager, aws-marketplace, ms-marketplace, gcp-marketplace. Each provider’s own infrastructure-as-code guide is on the site: AWS, Azure and Google Cloud.
Integration strengths
The sources used measure breadth and tooling, not integration quality, so the strengths below are limited to what they show. Claims about, for example, Microsoft 365 or .NET integration are not quantified by any dataset here and are not scored.
-
AWS: the widest mapped catalogue (31 of 31 categories), the most official SDK languages (11), the most downloaded Terraform provider (about 8.1 billion cumulative downloads against 2.1 billion for Azure and 2.7 billion for Google Cloud), and AWS Ground Station, for which Microsoft states that Azure has no managed equivalent and which the Google comparison page does not list. Sources: svc-ms-aws-index, sdkref-aws, terraform-registry.
-
Azure: Microsoft Entra ID is the mapped identity service, Azure DevOps and GitHub Actions are the mapped CI/CD services, and Azure Arc and Azure Local cover hybrid and edge, a category for which the Google comparison page lists no equivalent. Sources: svc-ms-aws-index, svc-ms-compute.
-
Google Cloud: BigQuery is the mapped data warehouse, Google Kubernetes Engine the mapped managed Kubernetes service, and Infrastructure Manager (Terraform-based) and Config Connector the native infrastructure as code. Sources: svc-gcp-comparison, svc-gcp-infra-manager.
The provider guides on this site cover each ecosystem in depth. Landing pages: AWS, Azure and Google Cloud. Compute decision guides: AWS, Azure and Google Cloud.
Learning curve
Ease of use cannot be measured directly, so this section lists the objective signals that were found and then states the editorial score and its basis. The signals are free tier and trial credit, certification and learning-path counts, and the Stack Overflow admired and desired scores (the share of developers who used a technology and want to keep using it, and the share who want to use it).
| Criterion | AWS | Azure | Google Cloud |
|---|---|---|---|
Trial credit |
USD 200 over 180 days |
USD 200 over 30 days |
USD 300 over 90 days |
Always-free products |
30+ services |
65+ services |
29 products |
Certifications |
11 |
20 |
13 |
AI-named certifications |
3 |
5 |
2 |
Vendor learning paths |
n/a |
283 |
n/a |
Vendor learning modules |
n/a |
1,161 |
n/a |
Stack Overflow 2026: used (secondary source) |
41.8% |
25.1% |
24.5% |
Stack Overflow 2026: admired (secondary source) |
45.8% |
43.2% |
42.6% |
Stack Overflow 2026: desired (secondary source) |
24.1% |
13.7% |
13.9% |
Always-free counts are not like for like: Google Cloud’s 29 is a count of the rows in its usage-limit table, AWS says more than 30 services and Azure more than 65. The AWS certification count is a lower bound because the professional tier rendered only partly, and Azure counts role-based and specialty titles containing the word Azure, excluding three marked Legacy. AWS and Google Cloud do not publish a learning-catalogue size, so those cells are n/a, while Microsoft Learn exposes a catalogue API (learning paths and modules tagged Azure). The Stack Overflow 2026 usage, admired and desired figures come from a Virtualization Review article (secondary source), and the 2024 and 2025 admired and desired figures for the three providers were not found. Sources: aws-free, azure-free, gcp-free, gcp-free-features, aws-cert, ms-learn-catalog, gcp-cert, so-2026-vr.
Two of the criteria in the list above, console and IAM complexity and the time to a first reference deployment, have no objective public measurement, and none was invented. The best way to judge them is to follow each provider’s getting-started guide on this site, which walks through a hands-on first deployment: AWS, Azure and Google Cloud. The identity pages (AWS, Azure, Google Cloud) show how much IAM surface each provider asks a new team to learn.
| Provider | Strengths shown by the data | Pain points shown by the data |
|---|---|---|
AWS |
Highest Stack Overflow usage (41.8%), admired (45.8%) and desired (24.1%) scores; a six-month free plan with up to USD 200 of credit; the most community Q&A volume implied by its usage |
The widest service surface (31 mapped categories) means the most to learn; only 11 certifications counted (lower bound); no public learning-catalogue size |
Azure |
The largest first-party learning catalogue found (283 learning paths and 1,161 modules on Microsoft Learn); 20 Azure certifications, 5 of them AI-named; more than 65 always-free services |
The shortest trial window (USD 200 over 30 days); admired score 43.2% is below AWS |
Google Cloud |
The longest and largest trial (USD 300 over 90 days); the leanest certification set (13), which keeps the learning path short |
The lowest admired score of the three (42.6%) and the fewest AI-named certifications (2); no public learning-content counts, so its catalogue could not be compared |
The editorial ease-of-use scores that follow from this evidence are 7 for AWS, 7 for Azure and 6.5 for Google Cloud on the 0 to 10 scale. The differences are small, and the score is a judgement, not a measurement.
Pricing
Like-for-like building blocks
The table lists list prices in US dollars for the common building blocks, on demand, in three comparable regions: US East (us-east-1 on AWS, eastus on Azure, us-east1 on Google Cloud), EU West (eu-west-1, westeurope, europe-west1) and Asia (ap-southeast-1, southeastasia, asia-southeast1). Each cell gives the price in the order US East / EU West / Asia. The prices are as of 2026-10-26 and come from the providers' price-list files and pricing pages.
| Building block | Unit | AWS | Azure | Google Cloud |
|---|---|---|---|---|
General-purpose VM (2 vCPU, 8 GiB, Linux) |
hour |
0.1008 / 0.11235 / 0.126 |
0.096 / 0.115 / 0.12 |
0.097118 / 0.106834 / 0.119806 |
Object storage, standard tier |
GB-month |
0.023 / 0.023 / 0.025 |
0.0208 / 0.0196 / 0.02 |
0.02 / 0.02 / 0.02 |
Object storage write requests |
1k requests |
0.005 / 0.005 / 0.005 |
0.005 / 0.0054 / 0.005 |
0.005 / 0.005 / 0.005 |
Object storage read requests |
1k requests |
0.0004 / 0.0004 / 0.0004 |
0.0004 / 0.00043 / 0.0004 |
0.0004 / 0.0004 / 0.0004 |
Internet egress, first paid tier |
GB |
0.09 / 0.09 / 0.12 |
0.087 / 0.087 / 0.12 |
0.12 / 0.12 / 0.12 |
Serverless functions, requests |
1M requests |
0.2 / 0.2 / 0.2 |
0.2 / 0.2 / 0.2 |
0.4 / 0.4 / 0.4 |
Serverless functions, compute |
GB-second |
0.0000167 / 0.0000167 / 0.0000167 |
0.000016 / 0.000016 / 0.000016 |
0.0000265 / 0.0000265 / 0.0000371 |
Managed Kubernetes control plane |
hour |
0.1 / 0.1 / 0.1 |
0.1 / 0.1 / 0.1 |
0.1 / 0.1 / 0.1 |
Small managed PostgreSQL instance, compute |
hour |
0.065 / 0.069 / 0.102 |
0.068 / 0.0796 / 0.104 |
0.1106 / 0.1106 / 0.1548 |
Managed PostgreSQL storage |
GB-month |
0.115 / 0.127 / 0.138 |
0.115 / 0.1369 / 0.138 |
0.17 / 0.17 / 0.238 |
Managed LLM API, input tokens (Claude Sonnet 5.5) |
1M tokens |
2 / 2 / 2 |
2 / 2 / 2 |
2 / 2 / 2 |
Managed LLM API, output tokens (Claude Sonnet 5.5) |
1M tokens |
10 / 10 / 10 |
10 / 10 / 10 |
10 / 10 / 10 |
Comparability notes:
-
The SKUs compared are listed in the next table. The VM is the closest general-purpose 2 vCPU, 8 GiB shape on each provider, not the same hardware.
-
The PostgreSQL rows are not strictly equivalent: Google Cloud SQL has no burstable 2 vCPU shape, so its price is for a dedicated-core instance (2 vCPU, 4 GiB), against burstable instances on AWS and Azure.
-
Egress is the first paid tier after each provider’s free allowance: 100 GB per month on AWS and Azure and 1 GiB on Google Cloud Premium Tier. AWS egress prices apply to all regions, so the Asia figure is the Singapore rate. Google Cloud Standard Tier is cheaper than Premium Tier but was not used.
-
The LLM rows are one and the same model, Claude Sonnet 5.5, at the same list price on all three providers (global endpoints). Regional endpoints carry a 10 percent premium on the providers that offer them, and on Azure the model is billed at Anthropic list rates through Azure Marketplace consumption units. Because the model and price are identical, the table compares availability and billing, not model price.
-
Azure publishes storage request prices per 10,000 operations and function executions per 10 executions; they are converted to the units shown.
| Building block | AWS SKU | Azure SKU | Google Cloud SKU |
|---|---|---|---|
General-purpose VM (2 vCPU, 8 GiB, Linux) |
m7i.large (2 vCPU, 8 GiB), Linux, shared tenancy |
Standard_D2s_v5 (2 vCPU, 8 GiB), Linux |
n2-standard-2 (2 vCPU, 8 GiB), Linux |
Object storage, standard tier |
S3 Standard, first 50 TB per month |
Blob Storage General Purpose v2, Hot tier, LRS, first 50 TB per month |
Cloud Storage Standard, single region |
Object storage write requests |
S3 Standard PUT, COPY, POST, LIST |
Hot LRS write operations (0.05 / 0.054 / 0.05 USD per 10K) |
Class A operations, flat namespace, Standard |
Object storage read requests |
S3 Standard GET and other requests |
Hot read operations (0.004 / 0.0043 / 0.004 USD per 10K) |
Class B operations, flat namespace, Standard |
Internet egress, first paid tier |
Data transfer out to the internet, first 10 TB per month after the free allowance |
Data transfer out, Microsoft global network routing, 100 GB to 10 TB tier |
Premium Tier egress to North America, Europe and Asia (excluding Korea and Indonesia), 1 GiB to 1,024 GiB tier |
Serverless functions, requests |
Lambda x86 requests |
Functions Consumption plan, executions (2e-06 USD per 10 executions) |
Cloud Run functions, request-based billing, requests |
Serverless functions, compute |
Lambda x86 duration, first 6 billion GB-seconds per month |
Functions Consumption plan, execution time |
Cloud Run functions, request-based, 1 vCPU and 1 GiB active time |
Managed Kubernetes control plane |
EKS cluster, standard support |
AKS Standard tier (Uptime SLA) |
GKE cluster management fee (Standard and Autopilot) |
Small managed PostgreSQL instance, compute |
RDS db.t4g.medium (2 vCPU, 4 GiB, burstable), PostgreSQL, Single-AZ |
Flexible server Burstable B2s (2 vCPU, 4 GiB) |
Cloud SQL Enterprise, db-custom-2-4096 (2 vCPU, 4 GiB, dedicated), single zone |
Managed PostgreSQL storage |
RDS General Purpose SSD (gp3) storage, Single-AZ |
Flexible server storage |
Cloud SQL SSD storage, single zone |
Managed LLM API, input tokens (Claude Sonnet 5.5) |
Claude Sonnet 5.5 on Amazon Bedrock, global endpoint, standard |
Claude Sonnet 5.5 on Microsoft Foundry, global standard deployment |
Claude Sonnet 5.5 on Vertex AI, global endpoint |
Managed LLM API, output tokens (Claude Sonnet 5.5) |
Claude Sonnet 5.5 on Amazon Bedrock, global endpoint, standard |
Claude Sonnet 5.5 on Microsoft Foundry, global standard deployment |
Claude Sonnet 5.5 on Vertex AI, global endpoint |

Sources: aws-price-ec2, aws-price-s3, aws-price-datatransfer, aws-price-lambda, aws-price-eks, aws-price-rds, aws-price-bedrock, azure-retail-prices-api, azure-foundry-ccu, anthropic-pricing, gcp-pricing-compute, gcp-pricing-storage, gcp-pricing-network, gcp-pricing-run, gcp-pricing-gke, gcp-pricing-sql, gcp-pricing-vertex.
Free tiers and trial credits
Free offers come in three forms: a trial credit for new accounts, services that are free for the first 12 months, and always-free allowances that renew monthly. They are not directly comparable, but they matter for small workloads and for learning. Allowances are those stated on the provider pages on the retrieval date.
| Provider | Type | Service | Allowance | Duration |
|---|---|---|---|---|
AWS |
trial-credit |
New account credits |
Up to 200 USD: 100 USD at signup plus up to 100 USD for exploring services |
6 months |
AWS |
always-free |
Lambda |
1,000,000 requests and 400,000 GB-seconds per month |
no end date |
AWS |
always-free |
Data transfer out to the internet |
100 GB per month, aggregated across regions |
no end date |
AWS |
always-free |
30+ other services (for example DynamoDB, S3) |
n/a |
no end date |
Azure |
trial-credit |
Free account credit |
200 USD |
30 days |
Azure |
12-month |
Virtual machines |
750 hours each of B1s, B2pts v2 and B2ats v2 per month |
12 months |
Azure |
12-month |
Azure Database for PostgreSQL |
750 hours of flexible server Burstable B1MS, 32 GB storage and 32 GB backup |
12 months |
Azure |
always-free |
Azure Functions |
1,000,000 requests per month |
no end date |
Azure |
always-free |
Azure Kubernetes Service |
Cluster management free (Free tier, no uptime SLA) |
no end date |
Azure |
always-free |
Azure Container Apps |
180,000 vCPU-seconds, 360,000 GiB-seconds and 2 million requests per month |
no end date |
Azure |
always-free |
Static Web Apps |
100 GB bandwidth, 2 custom domains, 0.5 GB storage per app |
no end date |
Azure |
12-month |
Blob Storage |
n/a |
n/a |
Google Cloud |
trial-credit |
Free Trial welcome credit |
300 USD |
90 days |
Google Cloud |
always-free |
Compute Engine |
1 non-preemptible e2-micro VM per month in us-west1, us-central1 or us-east1; 30 GB-months standard persistent disk; 1 GB egress from North America |
no end date |
Google Cloud |
always-free |
Cloud Storage |
5 GB-months regional storage, 5,000 Class A and 50,000 Class B operations, 100 GB egress from North America per month |
no end date |
Google Cloud |
always-free |
Cloud Run (request-based billing) |
2 million requests, 360,000 GB-seconds, 180,000 vCPU-seconds, 1 GB egress per month |
no end date |
Google Cloud |
always-free |
Cloud Run functions |
2 million invocations, 400,000 GB-seconds, 200,000 GHz-seconds, 5 GB egress per month |
no end date |
Google Cloud |
always-free |
Google Kubernetes Engine |
One free Autopilot or zonal Standard cluster per month (74.40 USD credit) |
no end date |
Restrictions and conditions are in the data file. AWS lists more than 30 other always-free services (for example DynamoDB and S3) without numeric limits on its free-tier page, so none are recorded. The free account for Azure is limited to new customers for the 12-month services, and the Google Cloud trial credit cannot pay for some AI services, GPUs or Marketplace products. Sources: aws-free, aws-price-lambda, aws-price-datatransfer, azure-free-faq, gcp-free, gcp-pricing-gke.
Discount models
All three providers discount committed or interruptible capacity. Headline maxima are the providers' own "up to" figures. Rows marked computed were calculated from the price lists for the named instance and are reproducible from the cited file.
| Provider | Mechanism | Applies to | Term | Discount |
|---|---|---|---|---|
AWS |
Savings Plans |
EC2, Fargate, Lambda and other compute (headline) |
1 or 3 years |
up to 72% |
AWS |
Reserved Instances, Standard |
EC2 |
1 or 3 years |
40% to 72% |
AWS |
Reserved Instances, Convertible |
EC2 |
1 or 3 years |
31% to 66% |
AWS |
Reserved Instance, Standard, No Upfront (computed) |
m7i.large Linux, us-east-1 |
1 year |
33.8% |
AWS |
Reserved Instance, Standard, All Upfront (computed) |
m7i.large Linux, us-east-1 |
3 years |
60.5% |
AWS |
Spot Instances |
EC2 |
none (interruptible) |
up to 90% |
Azure |
Reservations |
Virtual machines (Windows and Linux) |
1 or 3 years |
36% to 72% |
Azure |
Savings plan for compute |
VMs, App Service, Functions Premium, container services |
1 or 3 years |
11% to 65% |
Azure |
Reservation (computed) |
Standard_D2s_v5 Linux, East US |
1 year |
38.3% |
Azure |
Reservation (computed) |
Standard_D2s_v5 Linux, East US |
3 years |
60.5% |
Azure |
Hybrid Benefit, Windows Server |
Windows Server VMs with Software Assurance |
none (license) |
up to 80% |
Azure |
Hybrid Benefit, SQL Server |
SQL Server on VMs, SQL Database, Managed Instance |
none (license) |
up to 85% |
Azure |
Hybrid Benefit, Linux (RHEL and SLES) |
Red Hat and SUSE subscription VMs |
none (license) |
up to 76% |
Azure |
Spot Virtual Machines |
VMs |
none (evictable) |
up to 90% |
Google Cloud |
Compute Flexible CUD (spend-based, computed) |
n2-standard-2, us-east1 |
1 year |
28.0% |
Google Cloud |
Compute Flexible CUD (spend-based, computed) |
n2-standard-2, us-east1 |
3 years |
46.0% |
Google Cloud |
Resource-based CUD (computed) |
n2-standard-2, us-east1 |
1 year |
37.0% |
Google Cloud |
Resource-based CUD (computed) |
n2-standard-2, us-east1 |
3 years |
55.0% |
Google Cloud |
Sustained use discounts |
N1, M1, M2, f1-micro, g1-small (max 30%); N2, N2D, C2 (max 20%) |
automatic, monthly usage |
up to 30% |
Google Cloud |
Spot VMs |
Compute Engine VMs, GPUs, TPUs |
none (preemptible) |
up to 91% |
Hybrid Benefit applies to licenses you already own (not PostgreSQL), and Google sustained use discounts apply only to the older machine series listed on the Google page, so the n2-standard-2 used in this page would get at most 20%. Sources: aws-savingsplans, aws-ri, aws-spot, aws-price-ec2, azure-reservations, azure-hybrid, azure-spot, azure-retail-prices-api, gcp-cud-docs, gcp-pricing-compute, gcp-sud, gcp-spot.
The site’s billing guides cover how to apply these models: AWS cost management and support, Azure cost management and Google Cloud cost management and billing.
Worked example: four reference architectures
To make the building blocks concrete, one reference architecture per workload type is priced with the same sizing on each provider, in US East, for 730 hours (one month). The totals are computed arithmetically from the list prices in the previous section, with no free allowances, discounts, taxes or support, so each is an upper bound for a small account and not a quote. Totals are the sum of the unrounded line amounts, so a total can differ by one cent from the sum of the rounded lines shown. The inputs are listed in full so that anyone can reproduce them.
The official pricing calculators were not run to produce these totals. They are interactive and cannot be scripted, so the figures here are a hand calculation (quantity times unit price, summed). To reproduce an example in a calculator, add one line item per row below with the same region, quantity and SKU: the AWS Pricing Calculator (calculator.aws), the Azure pricing calculator (azure.microsoft.com/pricing/calculator) and the Google Cloud pricing calculator (cloud.google.com/products/calculator). The calculators apply free allowances and may round differently, so expect small differences from the totals below.
Static website
Site files in object storage with public reads and 500 GB of internet egress per month.
| Line | Quantity | Unit | AWS price | AWS USD | Azure price | Azure USD | Google price | Google USD |
|---|---|---|---|---|---|---|---|---|
Object storage for site files |
50 |
GB-month |
0.023 |
1.15 |
0.0208 |
1.04 |
0.02 |
1.00 |
Uploads and deployments |
10 |
1k requests |
0.005 |
0.05 |
0.005 |
0.05 |
0.005 |
0.05 |
Page and asset reads |
5,000 |
1k requests |
0.0004 |
2.00 |
0.0004 |
2.00 |
0.0004 |
2.00 |
Internet egress |
500 |
GB |
0.09 |
45.00 |
0.087 |
43.50 |
0.12 |
60.00 |
Total per month, USD |
48.20 |
46.59 |
63.05 |
Simple dynamic site
One web and app server, one small managed PostgreSQL instance with 50 GB of storage, 100 GB of uploads and backups, and 200 GB of egress.
| Line | Quantity | Unit | AWS price | AWS USD | Azure price | Azure USD | Google price | Google USD |
|---|---|---|---|---|---|---|---|---|
Web and app server |
730 |
hour |
0.1008 |
73.58 |
0.096 |
70.08 |
0.097118 |
70.90 |
Managed PostgreSQL instance |
730 |
hour |
0.065 |
47.45 |
0.068 |
49.64 |
0.1106 |
80.74 |
PostgreSQL storage |
50 |
GB-month |
0.115 |
5.75 |
0.115 |
5.75 |
0.17 |
8.50 |
Uploads and backups |
100 |
GB-month |
0.023 |
2.30 |
0.0208 |
2.08 |
0.02 |
2.00 |
Internet egress |
200 |
GB |
0.09 |
18.00 |
0.087 |
17.40 |
0.12 |
24.00 |
Total per month, USD |
147.08 |
144.95 |
186.13 |
Microservices
A managed Kubernetes cluster (control plane plus three worker VMs), one managed PostgreSQL instance with 100 GB, 200 GB of object storage and 1,000 GB of egress.
| Line | Quantity | Unit | AWS price | AWS USD | Azure price | Azure USD | Google price | Google USD |
|---|---|---|---|---|---|---|---|---|
Kubernetes control plane |
730 |
hour |
0.1 |
73.00 |
0.1 |
73.00 |
0.1 |
73.00 |
Worker nodes (3 VMs) |
2,190 |
hour |
0.1008 |
220.75 |
0.096 |
210.24 |
0.097118 |
212.69 |
Managed PostgreSQL instance |
730 |
hour |
0.065 |
47.45 |
0.068 |
49.64 |
0.1106 |
80.74 |
PostgreSQL storage |
100 |
GB-month |
0.115 |
11.50 |
0.115 |
11.50 |
0.17 |
17.00 |
Object storage |
200 |
GB-month |
0.023 |
4.60 |
0.0208 |
4.16 |
0.02 |
4.00 |
Internet egress |
1,000 |
GB |
0.09 |
90.00 |
0.087 |
87.00 |
0.12 |
120.00 |
Total per month, USD |
447.30 |
435.54 |
507.43 |
AI service
One application server, 3 million serverless function requests using 600,000 GB-seconds, 200 million input and 50 million output LLM tokens, 100 GB of document storage and 100 GB of egress.
| Line | Quantity | Unit | AWS price | AWS USD | Azure price | Azure USD | Google price | Google USD |
|---|---|---|---|---|---|---|---|---|
Application server |
730 |
hour |
0.1008 |
73.58 |
0.096 |
70.08 |
0.097118 |
70.90 |
Serverless function requests |
3 |
1M requests |
0.2 |
0.60 |
0.2 |
0.60 |
0.4 |
1.20 |
Serverless function compute |
600,000 |
GB-second |
0.0000167 |
10.00 |
0.000016 |
9.60 |
0.0000265 |
15.90 |
LLM input tokens |
200 |
1M tokens |
2 |
400.00 |
2 |
400.00 |
2 |
400.00 |
LLM output tokens |
50 |
1M tokens |
10 |
500.00 |
10 |
500.00 |
10 |
500.00 |
Document storage |
100 |
GB-month |
0.023 |
2.30 |
0.0208 |
2.08 |
0.02 |
2.00 |
Internet egress |
100 |
GB |
0.09 |
9.00 |
0.087 |
8.70 |
0.12 |
12.00 |
Total per month, USD |
995.48 |
991.06 |
1,002.00 |

Reading the result: AWS and Azure are within 4 percent of each other on every architecture (Azure is the cheapest in all four), while Google Cloud is 16 to 35 percent higher than the cheapest on the first three, mainly because of its higher egress price (0.12 against 0.09 and 0.087 per GB) and its dedicated-core PostgreSQL instance. The AI service differs by less than 1.5 percent between providers because the LLM tokens, at an identical price, make up 900 of roughly 1,000 dollars. List prices ignore the large free allowances described under free tiers, which would lower all three totals for small workloads. Sources: aws-price-ec2, aws-price-s3, aws-price-datatransfer, aws-price-lambda, aws-price-eks, aws-price-rds, aws-price-bedrock, azure-retail-prices-api, anthropic-pricing, gcp-pricing-compute, gcp-pricing-storage, gcp-pricing-network, gcp-pricing-run, gcp-pricing-gke, gcp-pricing-sql, gcp-pricing-vertex.
Availability regions
Regions and availability zones over time
Counts over time come from the providers' official infrastructure pages: the live page for the current value and archived snapshots of the same pages (Internet Archive) for earlier years. Where a page stated no total, the count was derived from the lists on it, and each such case is flagged in the data file. Microsoft counts announced regions (not only generally available ones) and states no availability-zone total on its history pages, so Azure appears only in the regions chart for earlier years.


| Year | AWS | Azure | Google Cloud |
|---|---|---|---|
2018 |
18 regions, 55 zones |
54 regions |
18 regions, 54 zones |
2020 |
24 regions, 77 zones |
60+ regions |
24 regions, 73 zones |
2022 |
27 regions, 87 zones |
60+ regions |
35 regions, 106 zones |
2024 |
34 regions, 108 zones |
60+ regions |
40 regions, 121 zones |
2026 |
39 regions, 124 zones |
70+ announced regions; 58 listed regions, 124 zones (41 regions with zones) |
43 regions, 130 zones |
Selected snapshots. For 2026, AWS states 124 availability zones within 39 geographic regions including GovCloud, China and the European Sovereign Cloud, Google Cloud lists 43 regions and 130 zones (last updated 2026-10-13), and the Azure regions page lists 58 public-cloud regions with 124 availability zones, 41 of the regions having zones. Microsoft’s own marketing count is 70 or more announced regions. AWS has announced 2 more regions and 7 more zones (Saudi Arabia and Chile). Sources: wayback-aws-global-infra, aws-global-infra, wayback-gcp-locations, wayback-gcp-regions-zones, gcp-locations, wayback-azure-global-infra, azure-products-by-region, azure-regions-list, azure-asia-blog.
The three providers' own pages describe their infrastructure in detail, so this page does not repeat it: AWS global infrastructure, Azure global infrastructure and Google Cloud global infrastructure.
Footprint by continent and country
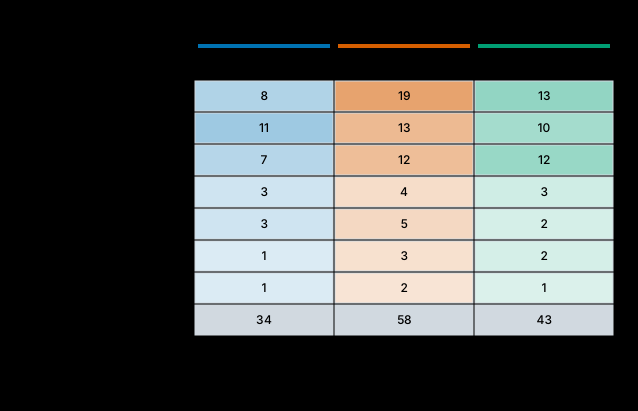
| Continent | AWS regions | Azure regions | Google Cloud regions | Countries and territories with a region |
|---|---|---|---|---|
North America |
7 |
12 |
12 |
3 |
Europe |
8 |
19 |
13 |
15 |
Asia Pacific |
11 |
13 |
10 |
9 |
Middle East |
3 |
4 |
3 |
5 |
Oceania |
3 |
5 |
2 |
2 |
South America |
1 |
3 |
2 |
2 |
Africa |
1 |
2 |
1 |
1 |
All |
34 |
58 |
43 |
37 |
Generally available public-cloud regions only: the China, government and sovereign partitions covered below, and announced regions, are not counted, which is why the AWS total here (34) is below the 39 geographic regions that AWS counts. The Azure count is the Microsoft regions list, which may include regions not open to every customer. Sources: aws-global-infra, aws-locations-json, aws-az-doc, gcp-locations, gcp-regions-zones, azure-regions-list, azure-geographies.
Jurisdictions where none of the three operates
The footprint data lists 37 countries and territories with at least one generally available public region of one of the three providers. Any jurisdiction not in the table below has no in-country region from any of them, and data there must be hosted in another country. On the African continent only South Africa has a region, and in South America only Brazil and Chile do (Chile has no AWS region yet). Mainland China is covered by partner-operated clouds only, as described next. Hong Kong and Taiwan are listed because all three providers operate there.
| Continent | Country or territory | Providers with a public region |
|---|---|---|
North America |
Canada |
AWS, Azure, Google Cloud |
North America |
Mexico |
AWS, Azure, Google Cloud |
North America |
United States |
AWS, Azure, Google Cloud |
Europe |
Austria |
Azure |
Europe |
Belgium |
Azure, Google Cloud |
Europe |
Denmark |
Azure |
Europe |
Finland |
Google Cloud |
Europe |
France |
AWS, Azure, Google Cloud |
Europe |
Germany |
AWS, Azure, Google Cloud |
Europe |
Ireland |
AWS, Azure |
Europe |
Italy |
AWS, Azure, Google Cloud |
Europe |
Netherlands |
Azure, Google Cloud |
Europe |
Norway |
Azure |
Europe |
Poland |
Azure, Google Cloud |
Europe |
Spain |
AWS, Azure, Google Cloud |
Europe |
Sweden |
AWS, Azure, Google Cloud |
Europe |
Switzerland |
AWS, Azure, Google Cloud |
Europe |
United Kingdom |
AWS, Azure, Google Cloud |
Asia Pacific |
Hong Kong |
AWS, Azure, Google Cloud |
Asia Pacific |
India |
AWS, Azure, Google Cloud |
Asia Pacific |
Indonesia |
AWS, Azure, Google Cloud |
Asia Pacific |
Japan |
AWS, Azure, Google Cloud |
Asia Pacific |
Malaysia |
AWS, Azure |
Asia Pacific |
Singapore |
AWS, Azure, Google Cloud |
Asia Pacific |
South Korea |
AWS, Azure, Google Cloud |
Asia Pacific |
Taiwan |
AWS, Azure, Google Cloud |
Asia Pacific |
Thailand |
AWS, Google Cloud |
Middle East |
Bahrain |
AWS |
Middle East |
Israel |
AWS, Azure, Google Cloud |
Middle East |
Qatar |
Azure, Google Cloud |
Middle East |
Saudi Arabia |
Google Cloud |
Middle East |
United Arab Emirates |
AWS, Azure |
Oceania |
Australia |
AWS, Azure, Google Cloud |
Oceania |
New Zealand |
AWS, Azure |
South America |
Brazil |
AWS, Azure, Google Cloud |
South America |
Chile |
Azure, Google Cloud |
Africa |
South Africa |
AWS, Azure, Google Cloud |
China
Mainland China is a separate market with its own legal and operating model, and the three providers differ sharply there:
| Provider | Offering | Operator | Scope | Regions | Status |
|---|---|---|---|---|---|
AWS |
AWS China (Beijing) Region |
Beijing Sinnet Technology Co., Ltd. (Sinnet) |
China only; separate partition and account |
cn-north-1 |
available (launched 2016-09) |
AWS |
AWS China (Ningxia) Region |
Ningxia Western Cloud Data Technology Co., Ltd. (NWCD) |
China only; separate partition and account |
cn-northwest-1 |
available (launched 2017-12) |
Azure |
Microsoft Azure operated by 21Vianet |
Shanghai Blue Cloud Technology Co., Ltd. (21Vianet) |
China only; physically separated instance; separate agreement (OSPA) |
China East; China East 2; China East 3; China North; China North 2; China North 3 |
available |
Google Cloud |
Google Cloud in mainland China |
none |
No region in mainland China |
none |
none |
-
Accounts: an AWS (China) account reaches only the Beijing and Ningxia regions, and accounts are not shared with the global partition. Azure operated by 21Vianet is a physically separated instance run under a separate agreement (OSPA). Google Cloud has no mainland China offering, so a customer there cannot be served from a Google Cloud region in the country.
-
ICP licensing: a public website served from mainland China needs an Internet Content Provider (ICP) filing with the Ministry of Industry and Information Technology (MIIT) if it is non-commercial, or a value-added telecommunications licence (the ICP licence) if it is commercial, on either provider. The customer obtains it and pays any government fees; the operators help with the paperwork. AWS says Sinnet (Beijing) and NWCD (Ningxia) support ICP requests at no extra charge, and that you may have to show the filing or licence before you host public content. On Amazon S3 in the China regions, anonymous GET requests and pre-signed URLs work only when the account has a valid ICP licence, so a public S3 static website needs one too. Microsoft says a domain without an ICP filing is not allowed online, and the filed domain must resolve to a filed IP address. A public security (PSB) filing is also due within 30 days of launch, or 21Vianet may suspend access. Both providers also require a legal entity in China (Azure) or a separate China account (AWS), so plan the filing before the launch date. Google Cloud has no mainland China region, so it has no ICP path of its own.
-
Service parity: Microsoft describes a feature parity gap with global Azure that is narrowing. No parity measurement was found for AWS China, so none is given.
-
Latency: the nearest Google Cloud regions to mainland China are Hong Kong (asia-east2) and Taiwan (asia-east1), as derived from the list of 43 regions. No latency measurements were gathered for this page.
Sovereign and government clouds
Government and sovereign offerings answer data-residency, operator-nationality and classification requirements that an ordinary public region does not. The table lists what each provider offers and its status on the retrieval date; status n/a means the page consulted gave no status or date.
| Provider | Category | Offering | Operator | Status |
|---|---|---|---|---|
AWS |
government |
AWS GovCloud (US) |
AWS (screened US persons) |
available (us-gov-west-1 launched 2011; us-gov-east-1 2018) |
AWS |
sovereign |
AWS European Sovereign Cloud |
Parent company and three local subsidiaries (GmbH) incorporated in Germany |
generally available (announced 2026-01-15) |
Azure |
government |
Azure Government |
Microsoft (screened US persons) |
available |
Azure |
government |
Azure Government Secret and Top Secret regions (US Sec East, US Sec West, US Sec West Central) |
n/a |
listed (available or coming soon; Microsoft does not separate them) |
Azure |
sovereign |
Microsoft Sovereign Public Cloud |
Microsoft |
n/a (no status or date on the page) |
Azure |
sovereign |
Microsoft Sovereign Private Cloud |
Microsoft |
n/a (no status or date on the page) |
Azure |
sovereign |
Microsoft Sovereign Partner Ecosystem and National Partner Cloud |
local partners |
n/a (listed without description or status) |
Azure |
sovereign |
Germany sovereign regions (Germany Northeast and Germany Central) |
n/a |
listed (available or coming soon; Microsoft does not separate them) |
Google Cloud |
government |
Assured Workloads |
available |
|
Google Cloud |
sovereign |
Google Cloud Data Boundary (public cloud) |
available |
|
Google Cloud |
sovereign |
Google Cloud Dedicated (partner-operated), France: S3NS PREMI3NS |
S3NS (Thales, standalone French entity) |
available; SecNumCloud 3.2 qualified (announced 2025-12-18) |
Google Cloud |
sovereign |
Google Cloud Dedicated, Germany: T-Systems |
T-Systems |
n/a (named only in a customer story on the sovereign cloud page) |
Google Cloud |
sovereign |
Google Distributed Cloud (connected and air-gapped) |
Google or customer |
available |
AWS GovCloud (US) comprises two isolated US regions with three zones each. Azure Government is physically isolated and US-only. Google Cloud offers Assured Workloads control packages (including FedRAMP Moderate and High, CJIS, IL2, IL4, IL5, IRS 1075 and ITAR) on its public regions and Google Distributed Cloud for air-gapped sites. The European options are the AWS European Sovereign Cloud (Brandenburg, Germany, announced generally available on 2026-01-15), the Azure sovereign programme and the partner-operated S3NS offering in France built on Google Cloud, which has SecNumCloud 3.2 qualification announced on 2025-12-18. Sources: aws-govcloud, aws-global-infra, aws-esc-press, aws-eu, aws-locations-json, azure-gov, azure-geographies, ms-sovereignty, gcp-assured, gcp-sovereign, s3ns-press.
Per-region service and AI model availability
Not every service or AI model is available in every region, and the gap is widest for newer AI models. The matrix below checks six representative offerings (managed Kubernetes, serverless functions, managed PostgreSQL and three AI models) in six representative regions: US East, Frankfurt, Tokyo, Singapore, Sydney and Sao Paulo. The AI models are Claude Sonnet 5.5 (the same model offered by all three), each provider’s own frontier model (Amazon Nova Pro, MAI-Thinking-1 and Gemini 4 Argon) and OpenAI GPT-6 Sol.
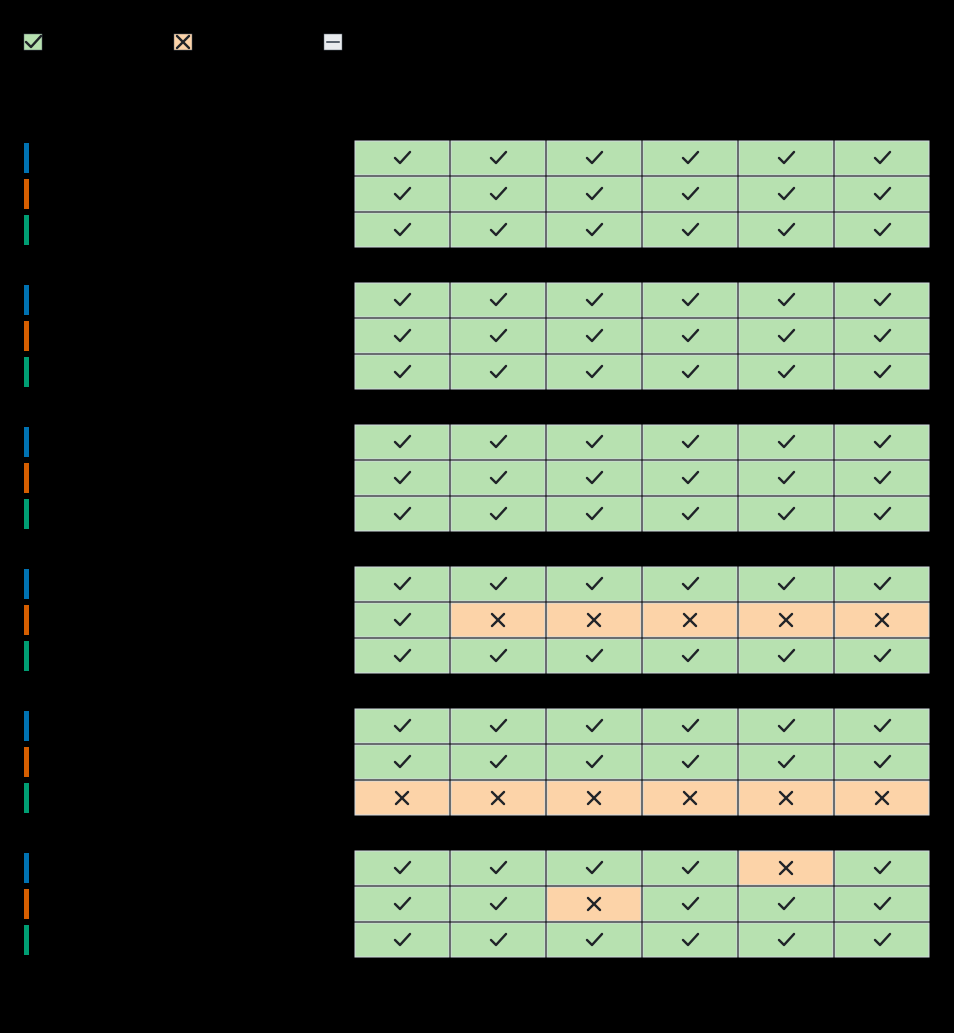
| Offering | AWS | Azure | Google Cloud |
|---|---|---|---|
Managed Kubernetes |
Amazon Elastic Kubernetes Service (EKS): 6 of 6 |
Azure Kubernetes Service (AKS): 6 of 6 |
Google Kubernetes Engine: 6 of 6 |
Serverless functions |
AWS Lambda: 6 of 6 |
Functions: 6 of 6 |
Cloud Run functions: 6 of 6 |
Managed PostgreSQL |
Amazon RDS for PostgreSQL: 6 of 6 |
Azure Database for PostgreSQL - Flexible Server: 6 of 6 |
Cloud SQL: 6 of 6 |
Claude Sonnet 5.5 (same model on all three) |
Claude Sonnet 5.5 on Amazon Bedrock: 6 of 6 |
Anthropic Claude Sonnet 5.5 on Microsoft Foundry: 1 of 6 (not in Frankfurt, Singapore, Tokyo, Sao Paulo, Sydney) |
Claude Sonnet 5.5 on Vertex AI: 6 of 6 |
Provider-native frontier model |
Amazon Nova Pro on Amazon Bedrock: 5 of 6 (not in Sao Paulo) |
MAI-Thinking-1 on Microsoft Foundry: 5 of 6 (not in Singapore) |
Gemini 4 Argon on Vertex AI: 6 of 6 |
GPT-6 Sol (OpenAI) |
GPT-6 Sol on Amazon Bedrock: 6 of 6 |
Azure OpenAI gpt-6-sol on Microsoft Foundry: 6 of 6 |
not listed on Vertex AI: 0 of 6 (none) |
Over all 36 offering and region combinations per provider, the offering is available in 35 (AWS), 30 (Azure) and 30 (Google Cloud). Availability does not always mean an in-region endpoint. On AWS, several models in some regions are reachable only through a geographic or global cross-Region inference profile. On Azure, a Global Standard deployment means requests may be processed in any Azure region, and the Claude model is available only in US East in the regions checked. On Google Cloud the Claude and Gemini models are served by the global endpoint in most regions checked, and OpenAI GPT-6 is not listed on Vertex AI (only open-weight gpt-oss models are). Check the data-processing location if residency matters. Sources: aws-regional-services, aws-bedrock-regions, azure-products-by-region, azure-foundry-region, azure-foundry-partners, gcp-locations-data, gcp-vertex-locations.
Use the official lookup tools for the regions and services you actually need: AWS Regional Services List, Amazon Bedrock model availability by region, Azure products available by region, Foundry Models region availability and Google Cloud locations with Vertex AI locations. The provider overviews on this site cover the AI services themselves: AWS, Azure (and Foundry Tools) and Google Cloud.
Other metrics
This section covers the other metrics that have reliable public data. Where none was found, the section says so instead of filling the gap.
Service-level agreements
The values are the availability thresholds in each provider’s SLA, below which service credits apply. They are commitments, not measured availability. The date in brackets is the last-updated date of the SLA page or document, which differs between providers (the AWS compute SLA was last updated in 2022).
| Service | AWS | Azure | Google Cloud |
|---|---|---|---|
Virtual machine, multiple zones |
99.99% (2022-05-25) |
99.99% (2026-10-01) |
99.99% (2026-10-14) |
Virtual machine, single instance |
99.5% (2022-05-25) |
99.9% (2026-10-01) |
99.9% (2026-10-14) |
Object storage, standard class |
99.9% (2023-11-28) |
99.9% (2026-10-01) |
99.9% (2026-10-14) |
Managed Kubernetes control plane |
99.95% (2026-03-20) |
99.95% (2026-10-01) |
99.95% (2026-10-14) |
Managed PostgreSQL, multi-zone |
99.95% (2024-01-22) |
99.99% (2026-10-01) |
99.95% (2025-10-03) |
Details: AWS RDS applies to the RDS family and not only PostgreSQL. Azure single-VM SLA requires Premium SSD or Ultra disks for all disks, and its PostgreSQL value is for zone-redundant high availability (same-zone high availability 99.95%, no high availability 99.9%). Google Cloud’s Cloud SQL value is for the Enterprise edition (Enterprise Plus 99.99%), and its regional Standard storage value is read from a merged table. Sources: sla-aws-compute, sla-aws-s3, sla-aws-eks, sla-aws-rds, sla-ms-online, sla-gcp-compute, sla-gcp-storage, sla-gcp-gke, sla-gcp-sql.
Compliance certifications
Only AWS publishes a count that could be read from page text: 60 certifications and attestations (89 programs including laws and frameworks). The Azure and Google Cloud compliance offering lists are rendered by script and state no total, so their counts are n/a here, and that says nothing about their breadth. All three publish detailed compliance catalogues, which should be checked for the specific standard needed (for example ISO 27001, SOC 2, FedRAMP or HIPAA). Sources: aws-compliance, azure-compliance, gcp-compliance.
Support plan pricing
| Plan | AWS | Azure | Google Cloud |
|---|---|---|---|
Entry plan |
USD 29 per month |
USD 29 per month |
USD 29 per month |
Production plan |
n/a |
USD 100 per month |
USD 100 per month |
Enterprise plan |
USD 5,000 per month |
USD 1,000 per month |
USD 15,000 per month |
Minimum monthly price of the entry, production and enterprise tiers. Plans are not like for like. AWS Business Support Plus is the greater of USD 29 or 9% of the first USD 10,000 of monthly charges, and AWS lists no separate production tier on the page fetched. Azure plans are flat monthly prices (Developer, Standard and Professional Direct), and Microsoft does not publish a price for Unified Enterprise. Google Cloud plans are the greater of a minimum or a percentage of charges (Standard 3%, Enhanced 10% down to 3% in tiers, Premium from USD 15,000). AWS Enterprise Support is 10% of the first USD 150,000 down to 3% in tiers. Sources: aws-support, azure-support, gcp-support.
Reliability and incident history
No reliable like-for-like incident history was found, so none is compared. AWS publishes no public machine-readable incident history for the window. The Azure post-incident review list is rendered by script, and the fetched view covered only two reports from 2026-09-29 and 2026-09-30. Google Cloud’s incident feed held only 8 incidents between February and October 2026, not a full 12 months. A count of incidents from such partial data would be misleading. Sources: aws-health, azure-status-history, gcp-status.
Sustainability
| Provider | Target year | Commitment and latest reported progress |
|---|---|---|
AWS |
2040 |
Amazon (Climate Pledge); 100% of electricity matched with renewable energy in 2025 |
Azure |
2030 |
Microsoft carbon negative by 2030 (announced 2020); total emissions +23.4% vs 2020 baseline in the 2025 report; 2026 report covers FY25 |
Google Cloud |
2030 |
Net-zero and 24/7 carbon-free energy goals for 2030; 2026 Environmental Report (data year 2025) says supply chain emissions grew 25% year over year |
The Google Cloud goals were confirmed through a search summary of the 2026 Environmental Report, and the Microsoft emissions increase through the 2025 report as cited in search results; the PDFs were not read in full. The three commitments are different (net zero, carbon negative, matching electricity with renewables) and are not directly comparable. Sources: amazon-sustainability, ms-sustainability, gcp-sustainability.
Job market and certification demand
No reliable public primary source of job-posting or certification-demand data by cloud provider was found. Only training-vendor blogs surfaced, and they were not used. The Stack Overflow usage figures under [Adoption and developer usage] are the closest available proxy for the size of the skills pool.
Scorecard
The radar chart summarises the six scored axes on a 0 to 10 scale, where 10 is the best of the three providers on that axis, not a theoretical maximum.

| Axis | Kind | AWS | Azure | Google Cloud |
|---|---|---|---|---|
Popularity |
Computed |
10.0 |
6.6 |
5.6 |
Ecosystem breadth |
Computed |
10.0 |
9.4 |
8.0 |
Ease of use |
Editorial |
7.0 |
7.0 |
6.5 |
Price competitiveness |
Computed |
9.8 |
10.0 |
8.4 |
Regional coverage |
Computed |
8.1 |
8.7 |
8.0 |
AI offering |
Editorial, low confidence |
8.0 |
9.0 |
8.0 |
Four axes are computed from the data files, by the rules in Criteria and score derivation, and are rounded to one decimal. Two are editorial: ease of use and AI offering were set by the author of the dataset from the criteria and evidence below, not by the providers or an analyst, and the AI offering score has low confidence because no model-quality or market data was fetched. Price competitiveness is computed from list prices only, so free tiers, discounts and support, which are not like for like, are not part of it. It replaced an earlier editorial score that had rated Google Cloud highest on trial credit and free tier size, because the list prices of the reference architectures make it the most expensive of the three.
Evidence for the computed axes (the inputs of each formula):
| Axis | Provider | Computation and inputs |
|---|---|---|
Popularity |
AWS |
Computed: 10 x mean(share/max share, usage/max usage). market-share.csv Synergy 2026-Q2 share 28% (max 28); learning.csv so_usage_2026 41.8% (max 41.8). Share is infrastructure-services spend; usage is developer-survey only |
Popularity |
Azure |
Computed: 10 x mean(share/max share, usage/max usage). market-share.csv Synergy 2026-Q2 share 20% (max 28); learning.csv so_usage_2026 25.1% (max 41.8). Share is infrastructure-services spend; usage is developer-survey only |
Popularity |
Google Cloud |
Computed: 10 x mean(share/max share, usage/max usage). market-share.csv Synergy 2026-Q2 share 15% (max 28); learning.csv so_usage_2026 24.5% (max 41.8). Share is infrastructure-services spend; usage is developer-survey only |
Ecosystem breadth |
AWS |
Computed: mean of service coverage and SDK coverage x 10. service-mapping.csv: 31 of 31 categories have a service; tooling.csv official_sdk_languages 11 of 11 (max) |
Ecosystem breadth |
Azure |
Computed: mean of service coverage and SDK coverage x 10. service-mapping.csv: 30 of 31 categories have a service; tooling.csv official_sdk_languages 10 of 11 (max) |
Ecosystem breadth |
Google Cloud |
Computed: mean of service coverage and SDK coverage x 10. service-mapping.csv: 24 of 31 categories have a service; tooling.csv official_sdk_languages 9 of 11 (max) |
Price competitiveness |
AWS |
Computed: 10 x mean over the 4 reference architectures of (cheapest total / own total). reference-totals.csv monthly list-price totals (static-site 48.20 USD; simple-dynamic-site 147.08 USD; microservices 447.30 USD; ai-service 995.48 USD). Excludes free tiers, discounts and support, which are not like for like |
Price competitiveness |
Azure |
Computed: 10 x mean over the 4 reference architectures of (cheapest total / own total). reference-totals.csv monthly list-price totals (static-site 46.59 USD; simple-dynamic-site 144.95 USD; microservices 435.54 USD; ai-service 991.06 USD). Excludes free tiers, discounts and support, which are not like for like |
Price competitiveness |
Google Cloud |
Computed: 10 x mean over the 4 reference architectures of (cheapest total / own total). reference-totals.csv monthly list-price totals (static-site 63.05 USD; simple-dynamic-site 186.14 USD; microservices 507.43 USD; ai-service 1002.00 USD). Excludes free tiers, discounts and support, which are not like for like |
Regional coverage |
AWS |
Computed: 10 x mean(public regions/most, public zones/most, sovereign categories/3). footprint.csv generally available public regions: 34 regions and 109 zones (China, government and sovereign partitions excluded); sovereign.csv: 3 of China, government and sovereign offerings available. Zone definitions differ between providers |
Regional coverage |
Azure |
Computed: 10 x mean(public regions/most, public zones/most, sovereign categories/3). footprint.csv generally available public regions: 58 regions and 124 zones (China, government and sovereign partitions excluded); sovereign.csv: 2 of China, government and sovereign offerings available. Zone definitions differ between providers |
Regional coverage |
Google Cloud |
Computed: 10 x mean(public regions/most, public zones/most, sovereign categories/3). footprint.csv generally available public regions: 43 regions and 130 zones (China, government and sovereign partitions excluded); sovereign.csv: 2 of China, government and sovereign offerings available. Zone definitions differ between providers |
Criteria and evidence for the editorial axes:
| Axis | Provider | Score | Evidence |
|---|---|---|---|
Ease of use |
AWS |
7.0 |
learning.csv: highest Stack Overflow admired (45.8) and desired (24.1) scores; free plan $200 for 6 months; most community Q&A volume implied by 41.8% usage. Pain point: widest service surface |
Ease of use |
Azure |
7.0 |
learning.csv: admired 43.2; largest first-party learning catalogue found (283 learning paths, 1,161 modules on Microsoft Learn); 20 Azure certifications; shortest free credit window (30 days) |
Ease of use |
Google Cloud |
6.5 |
learning.csv: admired 42.6 (lowest of the three); longest and largest trial ($300 for 90 days); leanest certification set (13); fewer public learning-content counts available |
AI offering |
AWS |
8.0 |
service-mapping.csv: Amazon SageMaker and Amazon Bedrock; learning.csv ai_named_certifications 3; no model-quality or market data included |
AI offering |
Azure |
9.0 |
service-mapping.csv: Azure Machine Learning and Microsoft Foundry plus document and speech services; learning.csv ai_named_certifications 5 (highest) |
AI offering |
Google Cloud |
8.0 |
service-mapping.csv: Vertex AI, Vertex AI Studio and Model Garden; learning.csv ai_named_certifications 2; Google’s comparison page lists no document or speech AI equivalents |
Sources for the evidence are listed under the Learning curve, Ecosystem and Popularity sections (aws-free, azure-free, gcp-free, aws-cert, ms-learn-catalog, gcp-cert, so-2026-vr).
Summary: which provider to choose
The recommendation below is drawn only from the metrics in the previous sections. Each cell is the fit of a provider for a workload (best fit, good fit or acceptable) with a relative index in brackets, where the best provider on the metric is 100. Fit is best at an index of 95 or more, good from 80 and acceptable below. The matrix is computed from the data files, so it matches the figure and can be regenerated.
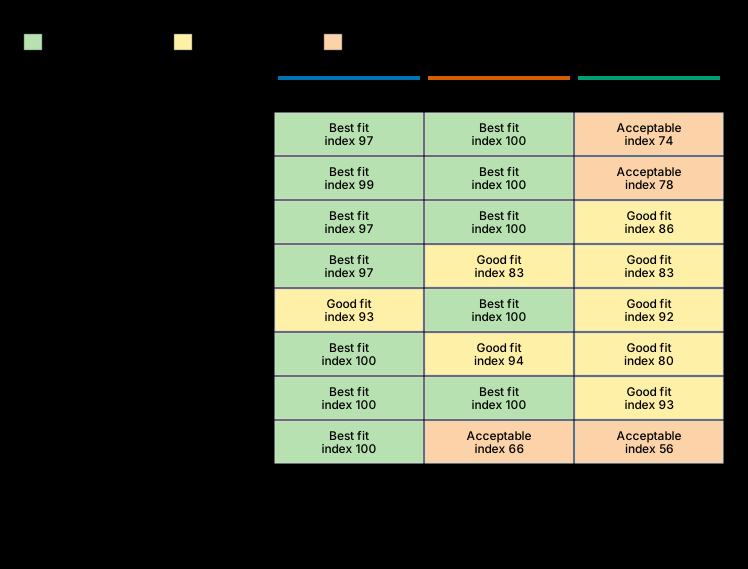
| Workload | AWS | Azure | Google Cloud | Metric behind the index |
|---|---|---|---|---|
Static website |
best (97) |
best (100) |
acceptable (74) |
Monthly list-price total of the static-site reference architecture (cheapest = 100) |
Dynamic site with a database |
best (99) |
best (100) |
acceptable (78) |
Monthly list-price total of the simple-dynamic-site reference architecture (cheapest = 100) |
Microservices on Kubernetes |
best (97) |
best (100) |
good (86) |
Monthly list-price total of the microservices reference architecture (cheapest = 100) |
AI service with managed LLMs |
best (97) |
good (83) |
good (83) |
Mean of the AI-service architecture price index and the share of frontier-model and region combinations that are available |
Global reach and sovereignty |
good (93) |
best (100) |
good (92) |
Regional coverage radar score |
Broad service catalogue |
best (100) |
good (94) |
good (80) |
Ecosystem breadth radar score |
Team onboarding and learning |
best (100) |
best (100) |
good (93) |
Ease of use radar score (editorial) |
Hiring and community support |
best (100) |
acceptable (66) |
acceptable (56) |
Popularity radar score |
The first four rows are the workload types, priced by the reference architectures. The next four are cross-cutting needs and are scored from the radar axes. The static website, dynamic site and microservices rows use list-price totals only, and the AI row averages the price index with the share of model and region combinations available (17 of 18 for AWS, 12 of 18 for Azure and for Google Cloud). The index for ease of use is based on an editorial score, and the index for hiring and community support on the popularity score, which includes survey usage (a secondary source for 2026). The optional data analytics and warehousing and batch and high-performance computing workload types are not rated, because no metric for them was gathered. The service mapping only shows that BigQuery, Azure Synapse Analytics and Amazon Redshift are the mapped data warehouses. Enterprise and Microsoft-centric workloads are rated qualitatively below, from the evidence already on this page.
Enterprise and Microsoft-centric workloads (editorial)
This row is not part of the computed matrix and has no index. It is an editorial reading of two sourced facts from earlier sections, and integration quality itself (Microsoft 365, .NET tooling) is still not measured:
-
Licence cost: Azure Hybrid Benefit is the only licence-reuse discount in the discount data, at up to 80% for Windows Server VMs and up to 85% for SQL Server (see Discount models). The discount data has no equivalent entry for AWS or Google Cloud, so Azure is the only one of the three for which this page quantifies a saving when existing Windows Server and SQL Server licences with Software Assurance are moved to the cloud.
-
Identity: Microsoft Entra ID is Azure’s mapped identity service (see Integration strengths), so an organisation that already runs Entra ID for Microsoft 365 starts with its identity provider in place.
| Workload | AWS | Azure | Google Cloud | Basis |
|---|---|---|---|---|
Enterprise and Microsoft-centric |
acceptable |
best |
acceptable |
Editorial, from the Hybrid Benefit discount data and the Entra ID service mapping; no index |
The rating says only that Azure has a documented licence and identity advantage for these workloads. AWS and Google Cloud both run Windows Server and SQL Server and offer their own licensing options, which this comparison did not gather, so check them before deciding on cost alone.
What the metrics say, workload by workload
-
Static website: Azure and AWS are best fit and within 4 percent on list price (USD 46.59 and 48.20 per month for the reference site), while Google Cloud is acceptable at USD 63.05, mainly because of its egress price. How-to guides: AWS static hosting, Azure Blob Storage and Google Cloud static sites.
-
Simple dynamic site: Azure (USD 144.95) and AWS (USD 147.08) are best fit. Google Cloud (USD 186.13) is acceptable, partly because its PostgreSQL shape is a dedicated-core instance. Compute guides: AWS, Azure and Google Cloud.
-
Microservices: Azure (USD 435.54) and AWS (USD 447.30) are best fit, Google Cloud (USD 507.43) is a good fit. All three charge the same USD 0.10 per hour for the managed Kubernetes control plane. Guides: AWS, Azure and Google Cloud.
-
Services using AI: the LLM price is identical on all three, so cost does not separate them (USD 991.06 on Azure, 995.48 on AWS and 1,002.00 on Google Cloud). Availability does: AWS offers the checked models in 17 of 18 combinations, against 12 of 18 for Azure and Google Cloud, so AWS is best fit and the other two are good fit. The result is specific to the models and regions checked. The AI offering radar score (editorial, low confidence) rates Azure highest. AI guides: AWS, Azure (with Foundry Tools) and Google Cloud.
Region constraints override these rankings, as the flowchart shows:
| Constraint | Options | Basis |
|---|---|---|
Mainland China |
AWS China (Sinnet and NWCD) or Azure operated by 21Vianet; no Google Cloud region in mainland China |
See China |
US government |
AWS GovCloud (US) or Azure Government; Google Cloud Assured Workloads on public regions |
|
EU data sovereignty |
AWS European Sovereign Cloud, Azure sovereign offerings, Google Cloud S3NS in France or its data boundary controls |
|
A needed service or AI model missing in your region |
Check the official lookup tools, choose a provider that lists it in the region, or use a global or cross-region endpoint if data residency allows |
Decision flowchart
The flowchart applies the region constraints first, because they remove options regardless of workload, and then picks by workload type.
The flowchart is a starting point and is limited to the data in this page. Re-run the comparison with current prices and the services, models and regions you actually need before committing.
Bibliography
Every data source behind this page, with its publication date or, where the page is a live document, the access date. All were accessed on 2026-10-26. Primary and official sources are listed first and secondary sources last. The identifier at the start of each entry is the one cited next to the tables and figures above.
Official provider documentation, price lists, SLAs and status pages
-
svc-gcp-comparison: Google Cloud, Google Cloud, AWS, and Azure services comparison (published 2024-12-03, accessed 2026-10-26)
-
svc-ms-aws-index: Microsoft Learn, Azure for AWS Professionals (published 2026-09-17, accessed 2026-10-26)
-
svc-ms-compute: Microsoft Learn, Compare AWS and Azure Compute Services (published 2026-06-01, accessed 2026-10-26)
-
svc-ms-storage: Microsoft Learn, Compare Storage Services on Azure and AWS (published 2026-10-05, accessed 2026-10-26)
-
svc-ms-databases: Microsoft Learn, Compare AWS and Azure Database Services (published 2026-10-05, accessed 2026-10-26)
-
svc-ms-dataai: Microsoft Learn, Compare AWS and Azure AI and machine learning services (published 2026-09-16, accessed 2026-10-26)
-
svc-gcp-infra-manager: Google Cloud, Infrastructure Manager overview (live page, accessed 2026-10-26)
-
sdkref-aws: AWS, AWS SDKs and Tools Reference Guide overview (live page, accessed 2026-10-26)
-
azure-sdk-releases: Microsoft, Azure SDK releases (live page, accessed 2026-10-26)
-
gcp-client-libraries: Google Cloud, Cloud Client Libraries (live page, accessed 2026-10-26)
-
aws-marketplace: AWS, AWS Marketplace (live page, accessed 2026-10-26)
-
ms-marketplace: Microsoft, Microsoft Marketplace (live page, accessed 2026-10-26)
-
gcp-marketplace: Google Cloud, Google Cloud Marketplace (live page, accessed 2026-10-26)
-
aws-free: AWS, AWS Free Tier (live page, accessed 2026-10-26)
-
azure-free: Microsoft, Azure free account (live page, accessed 2026-10-26)
-
gcp-free: Google Cloud, Google Cloud Free Program (live page, accessed 2026-10-26)
-
gcp-free-features: Google Cloud, Free cloud features and trial offer (live page, accessed 2026-10-26)
-
aws-cert: AWS, AWS Certification (live page, accessed 2026-10-26)
-
ms-learn-catalog: Microsoft Learn, Microsoft Learn catalog API (live page, accessed 2026-10-26)
-
gcp-cert: Google Cloud, Google Cloud certifications (live page, accessed 2026-10-26)
-
sla-aws-compute: AWS, Amazon Compute Service Level Agreement (published 2022-05-25, accessed 2026-10-26)
-
sla-aws-s3: AWS, Amazon S3 Service Level Agreement (published 2023-11-28, accessed 2026-10-26)
-
sla-aws-rds: AWS, Amazon RDS Service Level Agreement (published 2024-01-22, accessed 2026-10-26)
-
sla-aws-eks: AWS, Amazon EKS Service Level Agreement (published 2026-03-20, accessed 2026-10-26)
-
sla-ms-online: Microsoft, Service Level Agreement for Microsoft Online Services (WW), October 2026 (published 2026-10-01, accessed 2026-10-26)
-
sla-gcp-compute: Google Cloud, Compute Engine Service Level Agreement (published 2026-10-14, accessed 2026-10-26)
-
sla-gcp-storage: Google Cloud, Cloud Storage Service Level Agreement (published 2026-10-14, accessed 2026-10-26)
-
sla-gcp-gke: Google Cloud, Google Kubernetes Engine Service Level Agreement (published 2026-10-14, accessed 2026-10-26)
-
sla-gcp-sql: Google Cloud, Cloud SQL Service Level Agreement (published 2025-10-03, accessed 2026-10-26)
-
aws-compliance: AWS, AWS Compliance Programs (live page, accessed 2026-10-26)
-
azure-compliance: Microsoft Learn, Azure compliance offerings (published 2024-10-10, accessed 2026-10-26)
-
gcp-compliance: Google Cloud, Google Cloud compliance offerings (live page, accessed 2026-10-26)
-
aws-support: AWS, AWS Support pricing (live page, accessed 2026-10-26)
-
azure-support: Microsoft, Azure support plans (live page, accessed 2026-10-26)
-
gcp-support: Google Cloud, Google Cloud Customer Care plans (live page, accessed 2026-10-26)
-
aws-health: AWS, AWS Health Dashboard (live page, accessed 2026-10-26)
-
azure-status-history: Microsoft, Azure status history (live page, accessed 2026-10-26)
-
gcp-status: Google Cloud, Google Cloud Service Health incidents feed (live page, accessed 2026-10-26)
-
amazon-sustainability: Amazon, Amazon carbon-free energy (live page, accessed 2026-10-26)
-
ms-sustainability: Microsoft, Microsoft 2026 Environmental Sustainability Report (live page, accessed 2026-10-26)
-
gcp-sustainability: Google, Google 2026 Environmental Report (published 2026-06-30, accessed 2026-10-26)
-
aws-regions: AWS, AWS Regions and Availability Zones (live page, accessed 2026-10-26)
-
gcp-locations: Google Cloud, Google Cloud locations (live page, accessed 2026-10-26)
-
ms-regions-list: Microsoft Learn, Azure regions list (published 2026-10-13, accessed 2026-10-26)
-
aws-price-ec2: Amazon Web Services, AWS Price List bulk file, Amazon EC2, us-east-1, eu-west-1 and ap-southeast-1 (publication 2026-10-23) (published 2026-10-23, accessed 2026-10-26)
-
aws-price-s3: Amazon Web Services, AWS Price List bulk file, Amazon S3 (publication 2026-10-15) (published 2026-10-15, accessed 2026-10-26)
-
aws-price-lambda: Amazon Web Services, AWS Price List bulk file, AWS Lambda (published 2026-10-15, accessed 2026-10-26)
-
aws-price-eks: Amazon Web Services, AWS Price List bulk file, Amazon EKS (published 2026-10-15, accessed 2026-10-26)
-
aws-price-rds: Amazon Web Services, AWS Price List bulk file, Amazon RDS (published 2026-10-15, accessed 2026-10-26)
-
aws-price-datatransfer: Amazon Web Services, AWS Price List bulk file, AWS Data Transfer (published 2026-10-15, accessed 2026-10-26)
-
aws-price-bedrock: Amazon Web Services, AWS Price List bulk file, Amazon Bedrock Foundation Models (published 2026-10-15, accessed 2026-10-26)
-
azure-retail-prices-api: Microsoft, Azure Retail Prices API (live page, accessed 2026-10-26)
-
azure-foundry-ccu: Microsoft, Claude consumption units (CCU) billing in Microsoft Foundry (published 2026-09-11, accessed 2026-10-26)
-
anthropic-pricing: Anthropic, Claude pricing (Anthropic documentation) (live page, accessed 2026-10-26)
-
gcp-pricing-compute: Google Cloud, General-purpose machine family pricing (live page, accessed 2026-10-26)
-
gcp-pricing-storage: Google Cloud, Cloud Storage pricing (live page, accessed 2026-10-26)
-
gcp-pricing-network: Google Cloud, Network pricing (live page, accessed 2026-10-26)
-
gcp-pricing-run: Google Cloud, Cloud Run pricing (covers Cloud Run functions) (live page, accessed 2026-10-26)
-
gcp-pricing-gke: Google Cloud, Google Kubernetes Engine pricing (live page, accessed 2026-10-26)
-
gcp-pricing-sql: Google Cloud, Cloud SQL pricing (live page, accessed 2026-10-26)
-
gcp-pricing-vertex: Google Cloud, Vertex AI generative AI pricing (Agent Platform pricing) (live page, accessed 2026-10-26)
-
azure-free-faq: Microsoft, Azure free account FAQ (live page, accessed 2026-10-26)
-
aws-savingsplans: Amazon Web Services, AWS Savings Plans (live page, accessed 2026-10-26)
-
aws-spot: Amazon Web Services, Amazon EC2 Spot Instances (live page, accessed 2026-10-26)
-
aws-ri: Amazon Web Services, Amazon EC2 Reserved Instances (live page, accessed 2026-10-26)
-
azure-reservations: Microsoft, Azure Reservations and savings plan (live page, accessed 2026-10-26)
-
azure-hybrid: Microsoft, Azure Hybrid Benefit (live page, accessed 2026-10-26)
-
azure-spot: Microsoft, Azure Spot Virtual Machines (live page, accessed 2026-10-26)
-
gcp-cud-docs: Google Cloud, Committed use discounts overview (live page, accessed 2026-10-26)
-
gcp-sud: Google Cloud, Sustained use discounts (live page, accessed 2026-10-26)
-
gcp-spot: Google Cloud, Spot VMs (live page, accessed 2026-10-26)
-
aws-global-infra: Amazon Web Services, AWS Global Infrastructure (live page, accessed 2026-10-26)
-
aws-az-doc: Amazon Web Services, AWS Availability Zones (live page, accessed 2026-10-26)
-
aws-regions-doc: Amazon Web Services, AWS Regions (live page, accessed 2026-10-26)
-
aws-locations-json: Amazon Web Services, AWS locations data file (live page, accessed 2026-10-26)
-
aws-regional-services: Amazon Web Services, AWS Regional Services List (data file) (live page, accessed 2026-10-26)
-
aws-bedrock-regions: Amazon Web Services, Regional availability by models - Amazon Bedrock (live page, accessed 2026-10-26)
-
aws-china-about: Amazon Web Services China, About AWS China (live page, accessed 2026-10-26)
-
aws-china-faq: Amazon Web Services China, AWS China FAQs (ICP recordal and licence, operator support; live page, accessed 2026-10-26)
-
aws-china-s3: Amazon Web Services China, Amazon S3 in the China Regions (ICP licence for anonymous access and pre-signed URLs; live page, accessed 2026-10-26)
-
aws-china-endpoints: Amazon Web Services China, Service endpoints and quotas (AWS China documentation) (live page, accessed 2026-10-26)
-
aws-govcloud: Amazon Web Services, AWS GovCloud (US) (live page, accessed 2026-10-26)
-
aws-eu: Amazon Web Services, AWS European Sovereign Cloud (live page, accessed 2026-10-26)
-
gcp-regions-zones: Google Cloud, Regions and zones (published 2026-10-22, accessed 2026-10-26)
-
gcp-locations-data: Google Cloud, Google Cloud locations product data (live page, accessed 2026-10-26)
-
gcp-vertex-locations: Google Cloud, Deployments and endpoints (Vertex AI generative AI locations) (live page, accessed 2026-10-26)
-
gcp-sovereign: Google Cloud, Sovereign Cloud from Google (live page, accessed 2026-10-26)
-
gcp-assured: Google Cloud, Overview of Assured Workloads (published 2026-10-22, accessed 2026-10-26)
-
azure-regions-list: Microsoft, Azure regions list (published 2026-10-13, accessed 2026-10-26)
-
azure-geographies: Microsoft, Azure geographies (live page, accessed 2026-10-26)
-
azure-products-by-region: Microsoft, Products available by region (live page, accessed 2026-10-26)
-
azure-foundry-region: Microsoft, Region availability for Foundry Models sold by Azure (published 2026-10-19, accessed 2026-10-26)
-
azure-foundry-partners: Microsoft, Foundry Models from partners and community (region availability) (published 2026-09-22, accessed 2026-10-26)
-
azure-china: Microsoft, Microsoft Azure in China (published 2024-08-05, accessed 2026-10-26)
-
azure-china-regulations: Microsoft, Data sovereignty and China regulations (ICP and public security filing; updated 2024-08-05, accessed 2026-10-26)
-
azure-china-checklist: Microsoft, Azure in China checklist (legal entity, ICP filing and licence; updated 2025-06-18, accessed 2026-10-26)
-
azure-gov: Microsoft, Azure Government overview (published 2026-05-19, accessed 2026-10-26)
-
ms-sovereignty: Microsoft, Microsoft sovereign cloud (live page, accessed 2026-10-26)
Earnings releases and filings
-
amazon-q2-2026: Amazon.com, Inc., Amazon.com Announces Second Quarter Results (2026) (published 2026-07-30, accessed 2026-10-26)
-
amazon-q1-2026: Amazon.com, Inc., Amazon.com Announces First Quarter Results (2026) (published 2026-04, accessed 2026-10-26)
-
amazon-q4-2025: Amazon.com, Inc., Amazon.com Announces Fourth Quarter Results (2025) (published 2026-02, accessed 2026-10-26)
-
amazon-q3-2025: Amazon.com, Inc., Amazon.com Announces Third Quarter Results (2025) (published 2025-10, accessed 2026-10-26)
-
amazon-q2-2025: Amazon.com, Inc., Amazon.com Announces Second Quarter Results (2025) (published 2025-07, accessed 2026-10-26)
-
amazon-q1-2025: Amazon.com, Inc., Amazon.com Announces First Quarter Results (2025) (published 2025-05, accessed 2026-10-26)
-
amazon-q4-2024: Amazon.com, Inc., Amazon.com Announces Fourth Quarter Results (2024) (published 2025-02, accessed 2026-10-26)
-
amazon-q3-2024: Amazon.com, Inc., Amazon.com Announces Third Quarter Results (2024) (published 2024-10, accessed 2026-10-26)
-
amazon-q2-2024: Amazon.com, Inc., Amazon.com Announces Second Quarter Results (2024) (published 2024-08, accessed 2026-10-26)
-
amazon-q4-2023: Amazon.com, Inc., Amazon.com Announces Fourth Quarter Results (2023) (published 2024-02, accessed 2026-10-26)
-
amazon-q3-2023: Amazon.com, Inc., Amazon.com Announces Third Quarter Results (2023) (published 2023-10, accessed 2026-10-26)
-
amazon-q1-2023: Amazon.com, Inc., Amazon.com Announces First Quarter Results (2023) (published 2023-04, accessed 2026-10-26)
-
alphabet-q2-2026: Alphabet Inc., Alphabet Q2 2026 earnings release (8-K Exhibit 99.1) (published 2026-07-22, accessed 2026-10-26)
-
alphabet-q1-2026: Alphabet Inc., Alphabet Q1 2026 earnings release (8-K Exhibit 99.1) (published 2026-04-29, accessed 2026-10-26)
-
alphabet-q4-2025: Alphabet Inc., Alphabet Q4 2025 earnings release (8-K Exhibit 99.1) (published 2026-02-04, accessed 2026-10-26)
-
alphabet-q3-2025: Alphabet Inc., Alphabet Q3 2025 earnings release (8-K Exhibit 99.1) (published 2025-10-29, accessed 2026-10-26)
-
alphabet-q2-2025: Alphabet Inc., Alphabet Q2 2025 earnings release (8-K Exhibit 99.1) (published 2025-07-23, accessed 2026-10-26)
-
alphabet-q1-2025: Alphabet Inc., Alphabet Q1 2025 earnings release (8-K Exhibit 99.1) (published 2025-04-24, accessed 2026-10-26)
-
alphabet-q4-2024: Alphabet Inc., Alphabet Q4 2024 earnings release (8-K Exhibit 99.1) (published 2025-02-04, accessed 2026-10-26)
-
alphabet-q3-2024: Alphabet Inc., Alphabet Q3 2024 earnings release (8-K Exhibit 99.1) (published 2024-10-29, accessed 2026-10-26)
-
alphabet-q2-2024: Alphabet Inc., Alphabet Q2 2024 earnings release (8-K Exhibit 99.1) (published 2024-07-23, accessed 2026-10-26)
-
alphabet-q1-2024: Alphabet Inc., Alphabet Q1 2024 earnings release (8-K Exhibit 99.1) (published 2024-04-25, accessed 2026-10-26)
-
alphabet-q4-2023: Alphabet Inc., Alphabet Q4 2023 earnings release (8-K Exhibit 99.1) (published 2024-01-30, accessed 2026-10-26)
-
msft-fy26-q4: Microsoft Corporation, Microsoft FY26 Q4 earnings press release (publication date not stated, accessed 2026-10-26)
-
msft-fy26-q3: Microsoft Corporation, Microsoft FY26 Q3 earnings press release (publication date not stated, accessed 2026-10-26)
-
msft-fy26-q2: Microsoft Corporation, Microsoft FY26 Q2 earnings press release (publication date not stated, accessed 2026-10-26)
-
msft-fy26-q1: Microsoft Corporation, Microsoft FY26 Q1 earnings press release (publication date not stated, accessed 2026-10-26)
-
msft-fy25-q4: Microsoft Corporation, Microsoft FY25 Q4 earnings press release (publication date not stated, accessed 2026-10-26)
-
msft-fy25-q3: Microsoft Corporation, Microsoft FY25 Q3 earnings press release (publication date not stated, accessed 2026-10-26)
-
msft-fy25-q2: Microsoft Corporation, Microsoft FY25 Q2 earnings press release (publication date not stated, accessed 2026-10-26)
-
msft-fy25-q1: Microsoft Corporation, Microsoft FY25 Q1 earnings press release (publication date not stated, accessed 2026-10-26)
-
msft-fy24-q4: Microsoft Corporation, Microsoft FY24 Q4 earnings press release (publication date not stated, accessed 2026-10-26)
-
msft-fy24-q3: Microsoft Corporation, Microsoft FY24 Q3 earnings press release (publication date not stated, accessed 2026-10-26)
-
msft-fy24-q2: Microsoft Corporation, Microsoft FY24 Q2 earnings press release (publication date not stated, accessed 2026-10-26)
-
msft-fy24-q1: Microsoft Corporation, Microsoft FY24 Q1 earnings press release (publication date not stated, accessed 2026-10-26)
Market research and surveys
-
so-2025: Stack Overflow, Stack Overflow Developer Survey 2025: Technology (published 2025-07-01, accessed 2026-10-26)
-
so-2024: Stack Overflow, Stack Overflow Developer Survey 2024: Technology (published 2024-07-01, accessed 2026-10-26)
-
srg-2018-q3: Synergy Research Group, Synergy Research Group press release, cloud infrastructure services Q3 2018 (published 2018-10-25, accessed 2026-10-26)
-
srg-2019-q2: Synergy Research Group, Synergy Research Group press release, cloud infrastructure services Q2 2019 (published 2019-07-26, accessed 2026-10-26)
-
srg-2019-q3: Synergy Research Group, Synergy Research Group press release, cloud infrastructure services Q3 2019 (published 2019-10-29, accessed 2026-10-26)
-
srg-2019-q4: Synergy Research Group, Synergy Research Group press release, cloud infrastructure services Q4 2019 (published 2020-02-04, accessed 2026-10-26)
-
srg-2020-q2: Synergy Research Group, Synergy Research Group press release, cloud infrastructure services Q2 2020 (published 2020-07-30, accessed 2026-10-26)
-
srg-2020-q3: Synergy Research Group, Synergy Research Group press release, cloud infrastructure services Q3 2020 (published 2020-10-29, accessed 2026-10-26)
-
srg-2020-q4: Synergy Research Group, Synergy Research Group press release, cloud infrastructure services Q4 2020 (published 2021-02, accessed 2026-10-26)
-
srg-2021-q2: Synergy Research Group, Synergy Research Group press release, cloud infrastructure services Q2 2021 (published 2021-07-29, accessed 2026-10-26)
-
srg-2021-q3: Synergy Research Group, Synergy Research Group press release, cloud infrastructure services Q3 2021 (published 2021-10-28, accessed 2026-10-26)
-
srg-2021-q4: Synergy Research Group, Synergy Research Group press release, cloud infrastructure services Q4 2021 (published 2022-02-03, accessed 2026-10-26)
-
srg-2022-q1: Synergy Research Group, Synergy Research Group press release, cloud infrastructure services Q1 2022 (published 2022-04-28, accessed 2026-10-26)
-
srg-2022-q2: Synergy Research Group, Synergy Research Group press release, cloud infrastructure services Q2 2022 (published 2022-07-28, accessed 2026-10-26)
-
srg-2022-q3: Synergy Research Group, Synergy Research Group press release, cloud infrastructure services Q3 2022 (published 2022-10-27, accessed 2026-10-26)
-
srg-2022-q4: Synergy Research Group, Synergy Research Group press release, cloud infrastructure services Q4 2022 (published 2023-02-06, accessed 2026-10-26)
-
srg-2023-q1: Synergy Research Group, Synergy Research Group press release, cloud infrastructure services Q1 2023 (published 2023-04-27, accessed 2026-10-26)
-
srg-2023-q2: Synergy Research Group, Synergy Research Group press release, cloud infrastructure services Q2 2023 (published 2023-08-03, accessed 2026-10-26)
-
srg-2023-q3: Synergy Research Group, Synergy Research Group press release, cloud infrastructure services Q3 2023 (published 2023-10-26, accessed 2026-10-26)
-
srg-2023-q4: Synergy Research Group, Synergy Research Group press release, cloud infrastructure services Q4 2023 (published 2024-02-01, accessed 2026-10-26)
-
srg-2024-q1: Synergy Research Group, Synergy Research Group press release, cloud infrastructure services Q1 2024 (published 2024-04-30, accessed 2026-10-26)
-
srg-2024-q2: Synergy Research Group, Synergy Research Group press release, cloud infrastructure services Q2 2024 (published 2024-08-01, accessed 2026-10-26)
-
srg-2024-q3: Synergy Research Group, Synergy Research Group press release, cloud infrastructure services Q3 2024 (published 2024-11-01, accessed 2026-10-26)
-
srg-2024-q4: Synergy Research Group, Synergy Research Group press release, cloud infrastructure services Q4 2024 (published 2025-02-06, accessed 2026-10-26)
-
srg-2025-q1: Synergy Research Group, Synergy Research Group press release, cloud infrastructure services Q1 2025 (published 2025-05-01, accessed 2026-10-26)
-
srg-2025-q2: Synergy Research Group, Synergy Research Group press release, cloud infrastructure services Q2 2025 (published 2025-07-31, accessed 2026-10-26)
-
srg-2025-q3: Synergy Research Group, Synergy Research Group press release, cloud infrastructure services Q3 2025 (published 2025-10-31, accessed 2026-10-26)
-
srg-2025-q4: Synergy Research Group, Synergy Research Group press release, cloud infrastructure services Q4 2025 (published 2026-02-05, accessed 2026-10-26)
-
srg-2026-q1: Synergy Research Group, Synergy Research Group press release, cloud infrastructure services Q1 2026 (published 2026-04-29, accessed 2026-10-26)
-
srg-2026-q2: Synergy Research Group, Synergy Research Group press release, cloud infrastructure services Q2 2026 (published 2026-07-30, accessed 2026-10-26)
-
omdia-2025-q4: Omdia (incl. Canalys), Omdia (Canalys): Global cloud infrastructure spending rose 29% in Q4 2025 (published 2026-03, accessed 2026-10-26)
-
omdia-2025-q3: Omdia (incl. Canalys), Omdia: Global cloud infrastructure spending hits $102.6 billion, up 25% in Q3 2025 (published 2025-12, accessed 2026-10-26)
-
omdia-2025-q1: Omdia (incl. Canalys), Global cloud infrastructure spending rose 21% in Q1 2025 (published 2025-06, accessed 2026-10-26)
-
canalys-2024-q4: Canalys, Canalys Newsroom: Worldwide cloud service spending to grow by 19% in 2025 (published 2025-02, accessed 2026-10-26)
-
so-survey-2025: Stack Overflow, Stack Overflow Developer Survey 2025, Technology (published 2025, accessed 2026-10-26)
-
so-survey-2024: Stack Overflow, Stack Overflow Developer Survey 2024, Technology (published 2024, accessed 2026-10-26)
-
so-survey-2023: Stack Overflow, Stack Overflow Developer Survey 2023 (published 2023, accessed 2026-10-26)
-
so-survey-2022: Stack Overflow, Stack Overflow Developer Survey 2022 (published 2022, accessed 2026-10-26)
-
flexera-2025-blog: Flexera, The latest cloud computing trends: Flexera 2025 State of the Cloud Report (published 2025, accessed 2026-10-26)
-
flexera-2026-press: Flexera, Flexera finds cloud value is rising while AI waste grows (published 2026-03-18, accessed 2026-10-26)
-
cncf-survey-2025: Cloud Native Computing Foundation, The CNCF Annual Cloud Native Survey (2025) (published 2026-01-20, accessed 2026-10-26)
-
cncf-survey-2024: Cloud Native Computing Foundation, CNCF Annual Survey 2024 (published 2025, accessed 2026-10-26)
Provider and partner announcements and statements
-
gartner-mq-2024-azure: Microsoft, Microsoft Azure blog, Gartner Magic Quadrant tag (Strategic Cloud Platform Services 2024 recognition) (published 2024, accessed 2026-10-26)
-
gartner-mq-2025-aws: Amazon Web Services, AWS named as a Leader in 2025 Gartner Magic Quadrant for Strategic Cloud Platform Services for 15 years in a row (published 2025-08-15, accessed 2026-10-26)
-
gartner-mq-2025-google: Google Cloud, 2025 Gartner Magic Quadrant for Strategic Cloud Platform Services (Google Cloud page) (published 2025-08, accessed 2026-10-26)
-
gartner-mq-2026-aws: Amazon Web Services, AWS named a Leader in Gartner 2026 Strategic Cloud Platform Services Magic Quadrant, 16 years running (published 2026-09-04, accessed 2026-10-26)
-
gartner-mq-2026-google: Google Cloud, 2026 Gartner Magic Quadrant for Strategic Cloud Platform Services (Google Cloud page) (published 2026-09, accessed 2026-10-26)
-
aws-esc-press: Amazon, AWS Launches AWS European Sovereign Cloud and Announces Expansion Across Europe (published 2026-01-15, accessed 2026-10-26)
-
s3ns-press: Thales, S3NS announces SecNumCloud qualification for PREMI3NS, its trusted cloud offering (published 2025-12-18, accessed 2026-10-26)
-
azure-asia-blog: Microsoft Azure Blog, Microsoft’s commitment to supporting cloud infrastructure demand in Asia (published 2025-10-09, accessed 2026-10-26)
Public data services
-
github-api: GitHub, GitHub REST API (live page, accessed 2026-10-26)
-
terraform-registry: HashiCorp, Terraform Registry provider API (live page, accessed 2026-10-26)
-
pypistats: pypistats.org, PyPI Stats API (live page, accessed 2026-10-26)
-
npm-downloads: npm, npm downloads API (published 2026-07-01, accessed 2026-10-26)
Archived snapshots of official pages
-
wayback-aws-global-infra: Internet Archive (Wayback Machine) of Amazon Web Services, AWS Global Infrastructure, archived snapshots (live page, accessed 2026-10-26)
-
wayback-gcp-locations: Internet Archive (Wayback Machine) of Google Cloud, Google Cloud locations page, archived snapshots (live page, accessed 2026-10-26)
-
wayback-gcp-regions-zones: Internet Archive (Wayback Machine) of Google Cloud, Google Cloud regions and zones docs, archived snapshots (live page, accessed 2026-10-26)
-
wayback-azure-global-infra: Internet Archive (Wayback Machine) of Microsoft, Azure global infrastructure pages, archived snapshots (live page, accessed 2026-10-26)
Secondary sources (press coverage, used only where a primary source was not available and labelled in the text)
-
so-2026-vr: Virtualization Review (reporting the Stack Overflow 2026 Developer Survey), Stack Overflow survey: AWS leads cloud usage, Azure and Google nearly tied (published 2026-10-06, accessed 2026-10-26)
-
jetbrains-2025-awsinsider: AWS Insider (secondary, citing JetBrains), AWS swamps GCP, Azure among developers in ecosystem report (reporting JetBrains State of Developer Ecosystem 2025) (published 2025-10-20, accessed 2026-10-26)
-
gartner-mq-2020-sdx: SDxCentral (press coverage of Gartner), SDxCentral: Amazon, Microsoft, Google dominate Gartner cloud quadrant (published 2020-09, accessed 2026-10-26)
-
gartner-mq-2021-vr: Virtualization Review (press coverage of Gartner), Virtualization Review: Gartner cloud 2021 (published 2021-08-04, accessed 2026-10-26)
-
gartner-mq-2022-sdx: SDxCentral (press coverage of Gartner), SDxCentral: AWS outpaces Microsoft in lopsided cloud market (published 2022-11, accessed 2026-10-26)