Alertmanager
|
This section documents the current Prometheus 3.x line (latest 3.14.0) as published at the Prometheus documentation and the current Grafana 13.x line (latest 13.2.1) as published at the Grafana documentation, which are the references these pages are written and verified against. No specific patch version is pinned. Some capabilities (Grafana Enterprise-only features, Grafana Cloud-hosted services, and long-term-storage systems like Thanos/Cortex/Mimir) are linked, not documented in depth. This content was generated with the assistance of AI and should be verified against the official documentation before being relied on in production, since both projects iterate quickly. This section’s bibliography lists the reference material consulted while preparing these pages. |
Prometheus’s rule evaluation only decides that something is wrong and appends the result to
ALERTS, as covered in
Recording & Alerting Rules; it is
Alertmanager that turns a stream of firing alerts into an actual notification. Alertmanager is a
separate binary that Prometheus pushes alerts to over HTTP: it deduplicates alerts arriving from
multiple Prometheus servers, groups related ones into a single notification, throttles repeats,
silences or inhibits what should not page anyone right now, and finally dispatches to a receiver — email, Slack, PagerDuty, an arbitrary webhook. This page covers the routing tree, grouping and
throttling, receivers and templates, inhibition, silences, and running Alertmanager as a
highly-available cluster. The full picture is
Alerting overview.
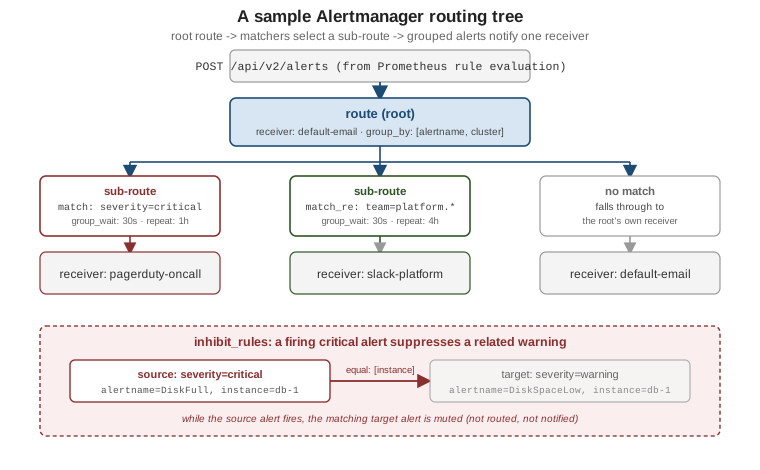
From rule evaluation to notification
Each Prometheus server ships alerts to one or more Alertmanager instances it knows about (via
static alerting.alertmanagers config or service discovery), independently of where it scrapes
metrics from:
# prometheus.yml
alerting:
  alertmanagers:
    - static_configs:
        - targets: ["alertmanager-1:9093", "alertmanager-2:9093"]
# https://prometheus.io/docs/alerting/latest/configuration/
An alert only reaches Alertmanager once its rule has been in the pending state for the rule’s
for duration and flips to firing; Alertmanager itself never evaluates PromQL, it only ever
receives and routes what Prometheus already decided is firing. Alertmanager’s own configuration
lives in alertmanager.yml, structured around a single top-level route tree, a receivers list
that tree’s routes point at, and top-level inhibit_rules:
# alertmanager.yml
route:
  receiver: default-email
  group_by: ["alertname", "cluster"]
  group_wait: 30s
  group_interval: 5m
  repeat_interval: 4h

receivers:
  - name: default-email
# https://prometheus.io/docs/alerting/latest/configuration/
Full reference and every option’s default: Configuration. The component itself, its data flow, and its HTTP API are documented at Alertmanager.
The routing tree
route is a tree, not a list: the top-level route is the root and always matches, and its
routes array nests child routes evaluated against each incoming alert’s labels. A route matches
an alert with match (exact label equality) or match_re (regular expression); by default the
first matching child route at each level wins and the alert is handed to it, unless that child
sets continue: true, in which case matching keeps evaluating sibling and, once inside it,
descendant routes too. Any label a child route does not use to match is inherited from its parent,
including receiver when a matching leaf route sets none of its own.
# alertmanager.yml
route:
  receiver: default-email
  group_by: ["alertname", "cluster"]
  group_wait: 30s
  group_interval: 5m
  repeat_interval: 4h

  routes:
    # Anything critical pages on-call, regardless of team.
    - match:
        severity: critical
      receiver: pagerduty-oncall
      group_wait: 30s
      repeat_interval: 1h

    # Platform team alerts (team label starting "platform") go to Slack,
    # and additionally keep evaluating so a separate audit route also fires.
    - match_re:
        team: platform.*
      receiver: slack-platform
      repeat_interval: 4h
      continue: true

    - match_re:
        team: platform.*
      receiver: audit-webhook
      continue: true

  # Everything else falls through to the root's own receiver: default-email.
Because matching is first-match-wins per branch, order child routes from most to least specific — a route for severity: critical placed after a broad catch-all team: .* route would never be
reached. See
Configuration for matchers (the newer
list syntax that supersedes match/match_re) and the full matching semantics.
Grouping and throttling
Alertmanager batches related alerts into one notification instead of paging once per firing time series, and throttles how often a still-firing group repeats:
| Setting | What it controls |
|---|---|
|
The label set that defines a group — alerts sharing these label values are bundled
into one notification. |
|
How long to wait after the first alert in a new group before sending the initial notification, so a few more related alerts arriving in that window join the same message. |
|
How long to wait before sending an update for a group that is still active but has gained or lost alerts since the last notification. |
|
How long to wait before re-sending a notification for a group that is still firing and otherwise unchanged. |
With group_by: ["alertname", "cluster"], DiskFull alerts from ten instances in the same cluster
collapse into one notification listing all ten, rather than ten separate pages. A child route
inherits any of these four settings it does not override, so only the ones that differ from a
parent need repeating (repeat_interval: 1h for a paging route, 4h for a lower-urgency one, as
above). See
Configuration for defaults and the
grouping algorithm in full.
Receivers and notification templates
A receivers entry names a destination and one integration config: email_configs,
slack_configs, webhook_configs, pagerduty_configs, and others. A route’s receiver is just a
name looked up in this list:
# alertmanager.yml
receivers:
  - name: default-email
    email_configs:
      - to: "oncall-fyi@example.com"
        send_resolved: true

  - name: pagerduty-oncall
    pagerduty_configs:
      - routing_key: "<pagerduty-integration-key>"
        send_resolved: true

  - name: slack-platform
    slack_configs:
      - api_url: "https://hooks.slack.com/services/T000/B000/XXXXXXXXXXXX"
        channel: "#platform-alerts"
        send_resolved: true
        title: '{{ template "slack.custom.title" . }}'
        text: '{{ template "slack.custom.text" . }}'

  - name: audit-webhook
    webhook_configs:
      - url: "https://audit.internal.example.com/hooks/alerts"
# https://prometheus.io/docs/alerting/latest/configuration/
send_resolved: true sends a follow-up notification when a group’s alerts stop firing, instead of
leaving the last message as the only word on it. Message content is built from Go templates over
each alert’s labels and annotations; a custom template lives in its own file and is loaded with
templates: at the top of alertmanager.yml:
{{/* templates/slack.tmpl */}}
{{ define "slack.custom.title" }}
[{{ .Status | toUpper }}] {{ .CommonLabels.alertname }} ({{ .CommonLabels.severity }})
{{ end }}

{{ define "slack.custom.text" }}
{{ range .Alerts }}
*{{ .Labels.instance }}*: {{ .Annotations.summary }}
{{ end }}
{{ end }}
# alertmanager.yml
templates:
- "/etc/alertmanager/templates/*.tmpl".Status, .CommonLabels, and .Alerts (each with its own .Labels/.Annotations) are the
notification data Alertmanager hands the template; the annotation text itself typically comes from
the alerting rule’s own annotations.summary/description, set up in
Recording & Alerting Rules. Every
receiver integration’s exact fields, and the full template data model, are in
Configuration.
Inhibition
An inhibit_rule suppresses one alert’s notification because a different, related alert is
already firing — typically a lower-severity alert made redundant by a higher-severity one covering
the same condition. It is configured once, at the top level of alertmanager.yml, not per route:
# alertmanager.yml
inhibit_rules:
  - source_matchers:
      - "severity=critical"
    target_matchers:
      - "severity=warning"
    equal: ["alertname", "instance"]
This reads as: while an alert matching source_matchers is firing, mute any alert matching
target_matchers whose labels listed in equal have the same values as the source alert’s. In the
diagram above, a firing DiskFull{severity="critical", instance="db-1"} inhibits
DiskSpaceLow{severity="warning", instance="db-1"} — same instance, so the warning is silently
dropped rather than routed and notified, avoiding a page and a separate lower-priority alert for
what is really one incident. equal is what keeps inhibition scoped: without instance in the
list, a critical alert on one host would suppress warnings on every host. See
Configuration for the full
inhibit_rules syntax.
Silences
A silence is a temporary, ad-hoc mute for any alert matching a given label set, created at runtime
rather than checked into alertmanager.yml — the tool for "we know about this, stop paging us for
it" during planned maintenance or a known ongoing incident. It always has a start time, an end
time, and a creator, and it expires on its own; no separate step removes it. Create one from the
Alertmanager web UI’s Silences tab, or from the command line with amtool:
amtool silence add \
  --alertmanager.url=http://alertmanager:9093 \
  --duration=2h \
  --comment="Planned maintenance on db-1" \
  instance=db-1 severity=critical
# https://prometheus.io/docs/alerting/latest/alertmanager/
amtool silence query lists active silences and amtool silence expire <id> ends one early. A
silence matches the same way a route matcher does (equality or regex on labels), so a silence on
instance=db-1 mutes every alert carrying that label, regardless of which route or receiver it
would otherwise have reached — silencing happens after grouping and routing decide where an alert
would go, not instead of them.
High-availability clustering
Running a single Alertmanager is a notification single point of failure, so production deployments
run a cluster of replicas, each fed the same alerts by every Prometheus server (as in the
static_configs example above, listing more than one Alertmanager target). Replicas talk to each
other over a gossip protocol to reach eventual agreement on which alerts and silences exist and
which notifications have already been sent, so the same firing alert reaching two replicas at once
is still only notified once:
./alertmanager \
  --cluster.listen-address=0.0.0.0:9094 \
  --cluster.peer=alertmanager-2:9094 \
  --cluster.peer=alertmanager-3:9094
# https://prometheus.io/docs/alerting/latest/high_availability/
Every replica needs --cluster.peer flags (or discovery) pointing at the others so the gossip mesh
can form; --cluster.listen-address is what peers gossip over, separate from the 9093 HTTP API
port clients and Prometheus talk to. Because deduplication happens through gossip rather than a
shared database, replicas tolerate a partition gracefully — each keeps notifying independently and
they reconcile once reconnected — at the cost of eventual, not immediate, consistency between them.
Full deployment guidance, including behavior during a partition and the peer-discovery options, is
in High availability.
Where alerts come from, and where they can go next
The alerts routed here are produced by
Recording & Alerting Rules — that page
covers writing the alert: rules and for/annotations that populate the labels this page’s
routes and inhibition rules match on. For visualizing the same alerting state on a dashboard rather
than receiving a push notification for it, see
Grafana Alerting. Longer-term storage and querying
of the underlying metrics that alerting rules evaluate is covered in
Storage, Federation & Remote
Write, and hardening Alertmanager (and the rest of the stack) for production is in
Security & Production Operations.