Clustering
|
This content was generated with the assistance of AI and should be verified against the official documentation before being relied on in production. The reference material consulted while preparing these pages is listed in the section bibliography. |
Quartz clustering is the feature that lets several copies of one service share one schedule: every job still runs once per fire time, and if the node that was running a job dies, a survivor can run it again. It is built on nothing but the job store’s database, which is why it appears here after the generic ideas of Job Stores & Persistence and the reference database page Quartz on PostgreSQL. This page collects what is common to all databases and everything that is only about the cluster: the mechanics (locks, check-ins, instance ids), who fires what (nobody balances the load), what happens when a node dies and how long it takes, the clock requirement, the one setup mistake that corrupts a cluster, the three acquisition tuning properties, the scaling limit, the community stores that claim to cluster, running it on Kubernetes, Terracotta (gone), the official Example 13, and a three-node Bookshelf cluster with a weekly report that survives a kill -9.
It was written against Quartz 2.5.2, Spring Boot 4.1.1, Spring Framework 7.0.9 and Java 21 (bytecode level; the build ran on JDK 25.0.2 with Maven 3.9.16) and verified on 5 October 2026. Every default and name below was read from the Quartz 2.5.2 sources (JobStoreSupport, StdRowLockSemaphore, StdSchedulerFactory, QuartzSchedulerThread, the instance id generators) and every behaviour that the page states as measured was run against PostgreSQL 17 (postgres:17, 17.11, native arm64) with Testcontainers 2.0.5 on one Apple Silicon laptop, with the nodes either as threads of one JVM or, where a node had to be killed or signalled, as separate JVMs. Those numbers show that a mechanism works and how its timing is composed; they are not a benchmark. Two-node cluster runs on MySQL 9, MariaDB 11, Oracle Free and SQL Server 2022 (no duplicate executions, work shared) are reported on the pages of those databases. Spring Boot 3.5.16 manages the same Quartz 2.5.2, so every statement about Quartz is identical; only the package of the Boot types (org.springframework.boot.autoconfigure.quartz instead of org.springframework.boot.quartz.autoconfigure) and Spring Framework 6.2.19 differ, and the page was not re-run on Boot 3.5. The Kubernetes manifests are illustrative: they were not applied to a cluster in this verification (no cluster was available); the application-side configuration inside them was run with plain JVMs and environment variables.
How JDBC clustering works
Nodes of a cluster never talk to each other. Each node is a normal scheduler that uses the same tables, the same scheduler name (the SCHED_NAME column of every table) and the same configuration, and the database is the only coordinator. Three things make that safe: two row locks, a heartbeat row per node, and an instance id that is unique per node.
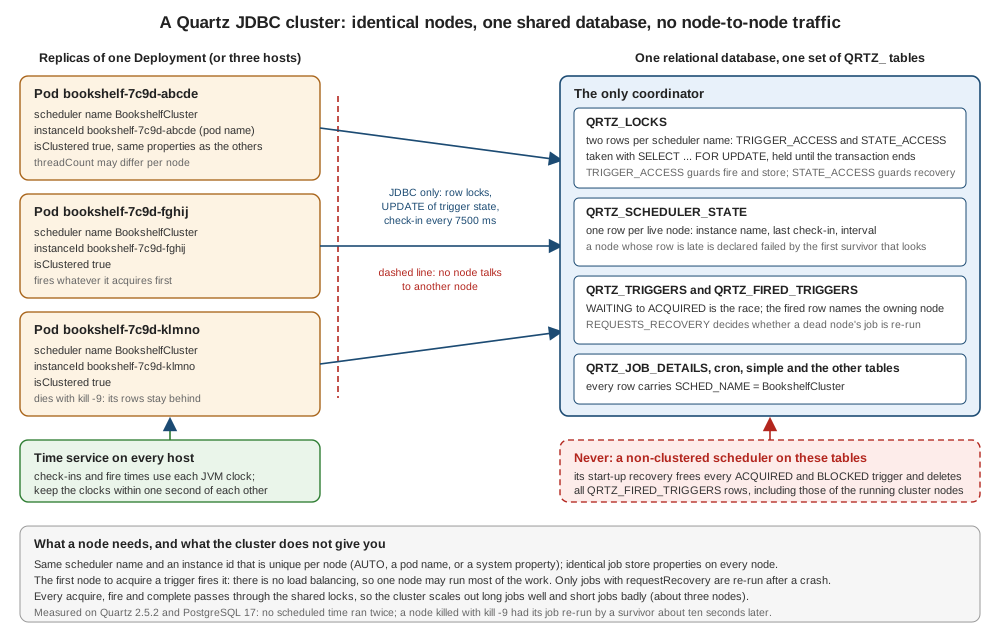
The two row locks in QRTZ_LOCKS
QRTZ_LOCKS holds two rows per scheduler name, TRIGGER_ACCESS and STATE_ACCESS (the constants LOCK_TRIGGER_ACCESS and LOCK_STATE_ACCESS in JobStoreSupport). A lock is taken by StdRowLockSemaphore with a SELECT * FROM QRTZ_LOCKS WHERE SCHED_NAME = ? AND LOCK_NAME = ? FOR UPDATE inside the transaction that does the work; it is released when that transaction commits or rolls back. If the row does not exist yet Quartz inserts it and tries again; if the lock attempt fails the semaphore retries up to maxRetry = 3 times, retryPeriod = 1000 ms apart. As soon as org.quartz.jobStore.isClustered is true the store forces useDBLocks on, so the row locks are always the mechanism in a cluster. Without clustering, a plain JobStoreTX uses a JVM monitor instead; JobStoreCMT, and therefore Boot’s LocalDataSourceJobStore, always uses the database row locks, clustered or not (except on HSQLDB, where Spring installs a JVM-local SimpleSemaphore). The statements PostgreSQL actually logged are on Quartz on PostgreSQL; SQL Server needs WITH (UPDLOCK,ROWLOCK), which JobStoreSupport defaults in for MSSQLDelegate (see Quartz on SQL Server).
| Lock | Taken by |
|---|---|
|
Firing a trigger ( |
|
Only the cluster check-in, and only when it has work to do: the first check-in of a node and whenever a failed node was found. It is taken before |
Check-ins in QRTZ_SCHEDULER_STATE
Every node runs a ClusterManager thread (an inner class of JobStoreSupport, started when the scheduler starts, only in clustered mode). Every clusterCheckinInterval milliseconds it updates the node’s row in QRTZ_SCHEDULER_STATE (INSTANCE_NAME, LAST_CHECKIN_TIME, CHECKIN_INTERVAL), inserting the row the first time, and at the same time it reads all rows to see whether another node is late. The default is 7500 ms in the source. The Quartz configuration page for JobStoreTX says 15000; the source wins, and the value the page documents is not the one the code uses. A late node is handled by the rule in the fail-over section.
A clean shutdown does not delete the node’s row: JobStoreSupport.shutdown() stops the ClusterManager and the misfire thread and releases the connections, and that is all. The row of a node that stopped cleanly therefore stays until a survivor declares it failed and removes it (measured below: about ten seconds later).
Instance ids: AUTO, SYS_PROP and generators
Every node needs an id that no other node of the same scheduler name uses. org.quartz.scheduler.instanceId takes a literal, AUTO or SYS_PROP:
| Setting | Id that results | When to use |
|---|---|---|
|
|
Anything that is not a Kubernetes pod; also fine in a pod (the hostname of a pod is its name), but then the id changes at every restart |
|
The host name alone (measured: it equals |
One node per host or per pod, when a stable id across restarts is wanted |
|
The value of the system property |
Ids handed in by the launcher, for example |
|
Whatever |
A pod name from the downward API, see Kubernetes |
Source: Quartz documentation: Configure the scheduler, StdSchedulerFactory source at v2.5.2 and SimpleInstanceIdGenerator source at v2.5.2
AUTO ids are host name plus epoch milliseconds, so two nodes on the same host that start in the same millisecond would collide; on different hosts or in different pods they cannot. The scheduler name is the other half of the identity: under Spring Boot it is spring.quartz.scheduler-name (the bean name quartzScheduler when unset), and every node of one logical cluster must use the same one.
Identical configuration
Quartz’s rule is that every node uses the same properties, the allowed differences being the thread pool size and the instance id. Under Boot that means the same spring.quartz.* block in every node. This is the configuration that was run for every measurement below (the first node runs with initialize-schema: always, or a migration tool creates the tables once, as described on Job Stores & Persistence):
spring:
  quartz:
    job-store-type: jdbc
    scheduler-name: BookshelfCluster
    jdbc:
      initialize-schema: never            # Flyway or Liquibase created the QRTZ_ tables
    properties:
      org.quartz.scheduler.instanceId: AUTO
      org.quartz.jobStore.driverDelegateClass: org.quartz.impl.jdbcjobstore.PostgreSQLDelegate
      org.quartz.jobStore.isClustered: "true"
      org.quartz.jobStore.clusterCheckinInterval: "2000"   # the measurements below use 2000, the default is 7500
      org.quartz.threadPool.threadCount: "3"
Source: Spring Boot: Quartz Scheduler and Quartz documentation: Configure Clustering with JDBC-JobStore
Boot builds a LocalDataSourceJobStore (a JobStoreCMT subclass) from job-store-type: jdbc; the scheduler reports clustered=true and the log says Using job-store 'org.springframework.scheduling.quartz.LocalDataSourceJobStore' - which supports persistence. and is clustered. The other spring.quartz.* properties are on Spring Boot Configuration for Quartz.
| Property | Default | Effect |
|---|---|---|
|
|
Turns clustering on and forces row locks |
|
|
Check-in period; also the base of the failure rule |
|
|
|
|
|
Only used with |
|
|
How long the cluster manager and the misfire handler wait after a failed database call before they try again |
|
|
Take |
|
|
Triggers one node may acquire at once |
|
|
How far ahead of its time a trigger may be acquired and fired |
|
|
The row lock statement; |
Who fires: there is no load balancing
When a trigger is due, the first node to acquire it fires it; every fire time runs on exactly one node. "Acquire" is a state change in the database, not a lock held for the whole wait: in the default configuration a node selects the due triggers, issues UPDATE QRTZ_TRIGGERS SET TRIGGER_STATE = 'ACQUIRED' WHERE … AND TRIGGER_STATE = 'WAITING' for the one it wants, and inserts a QRTZ_FIRED_TRIGGERS row with its own instance id. The node whose update matches a row owns the trigger; the other node’s update matches nothing (it waits for the winner’s commit, then sees ACQUIRED) and it moves to the next trigger. Only when the node actually fires the trigger does it take TRIGGER_ACCESS (triggersFired), re-check that the state is still ACQUIRED, mark the fired row EXECUTING and compute the next fire time.
Source: JobStoreSupport source at v2.5.2 (acquireNextTrigger, triggerFired) and Quartz documentation: Configure Clustering with JDBC-JobStore
Quartz documents the result as more or less random: near-random for busy schedulers, favouring the node that was just active for quiet ones (Lesson 11 and the clustering page). That is a description, not a guarantee, and the measurements here show how loose it is:
| Run | What was counted | Result |
|---|---|---|
Three schedulers in one JVM, 12 s, jobs every 1 s and 2 s |
Executions of |
|
Two schedulers in one JVM, six one-shot triggers due at the same instant, three runs |
Executions per node |
Split 3 and 3 once, and all six on a single node in the other two runs |
Source: Quartz Tutorial: Lesson 11, Advanced (Enterprise) Features. The first row is the PostgreSQL three-node run of this section’s verification, the second row ran with the default acquisition settings; both are single runs on one laptop.
So a cluster is a high-availability device first. It does give you "exactly once per fire time" and it does keep working when a node dies; it does not spread the work evenly, and a design that needs the work spread (a heavy report on each of three nodes) must create several jobs or several triggers rather than rely on the cluster to split one. The Quartz documentation adds that clustering works best for scaling out long-running or CPU-intensive jobs; for thousands of short jobs it recommends partitioning the jobs over several distinct schedulers (see Scaling limits).
Fail-over and recovery
A node that dies (a crash, kill -9, a lost host, an evicted pod) leaves three kinds of evidence in the database: its row in QRTZ_SCHEDULER_STATE stops being refreshed, its QRTZ_FIRED_TRIGGERS rows stay, and the triggers it had acquired stay ACQUIRED or BLOCKED. Every surviving node’s ClusterManager looks for exactly that at each check-in.
How a failed node is detected
A node is declared failed when lastCheckin + max(checkinInterval, now - ownLastCheckin) + 7500 ms is in the past (calcFailedIfAfter). lastCheckin and checkinInterval are the dead node’s own row; now is the observer’s clock and ownLastCheckin is the observer’s previous check-in, so the second term is about one check-in interval. The 7500 ms is a fixed grace period that cannot be configured. Checks happen once per interval, so, with I the check-in interval and the kill at a random moment after the dead node’s last check-in:
clusterCheckinInterval |
Derived range after the crash | Measured (PostgreSQL 17, kill -9 or SIGTERM) |
|---|---|---|
2000 ms |
from 7.5 s to 11.5 s |
8.1 to 10.2 s (five runs, the PostgreSQL page), 9.7 s, 10.8 s, 11.1 s and 11.2 s (this page and the section’s first test); each is the time until the survivor started the job again |
7500 ms (default) |
from 7.5 s to 22.5 s |
not measured; derived from the same rule |
The range is "the interval plus the grace, plus the wait for the next check-in of the observer", which is why a short interval buys faster fail-over at the price of more check-in traffic (each check-in is a select of all rows and an update of the node’s own row, with the locks taken only when there is work). The same rule bounds how long a job that is merely slow can run without being mistaken for a dead node: the check-in is done by the ClusterManager, not by the job threads, so a long job does not stop a node from checking in. A node that is paused (a long stop-the-world garbage collection, a stopped container, a database outage longer than the grace) does stop checking in and will be declared failed while still alive; the node’s own next check-in then logs a warning that the instance is still active but was recovered by another instance in the cluster.
What recovery does
The survivor that gets STATE_ACCESS first does the whole recovery in one transaction (clusterRecover), and the other survivors find nothing to do when they get the lock, because the check-in re-reads the failed rows after taking the lock. For each QRTZ_FIRED_TRIGGERS row of the dead node the rules are:
| State of the row | Action |
|---|---|
|
The trigger goes back to |
|
A |
|
Cleaned up. The execution is lost; the trigger’s next fire time is the one that runs |
|
The job’s other triggers are released to |
The job is |
Its triggers are returned from |
A |
The trigger is deleted |
Source: JobStoreSupport source at v2.5.2 (clusterRecover), Scheduler source at v2.5.2 (DEFAULT_RECOVERY_GROUP, FAILED_JOB_ORIG…) and Quartz API: JobExecutionContext
The consequence for job design is the whole point of the weekly report in the worked example: a recoverable job runs at least once, and possibly twice if the crash came after it had done most of its work but before its fired row was deleted. A job declared with requestRecovery(true) must therefore be written so that running it twice is harmless, which is a statement about the job and not about Quartz. The job data model of Jobs & Job Data and the way a held-back (BLOCKED) trigger turns into a misfire on Misfires decide what a recovered run sees.
Restarting with the same instance id
If a node that crashed comes back with the same instance id, it does not wait for another node: at its own first check-in findFailedInstances treats its old row as a failed instance (firstCheckIn is true) and recovers it, and fired-trigger rows whose instance has no row at all are recovered as "orphaned". Measured with two kill-and-restart runs of the 25-second recoverable job (clusterCheckinInterval 2000, no other node alive):
| Replacement node | Recovered after | What recovered it |
|---|---|---|
Restarted with the same instance id ( |
1.9 s (including the JVM start) |
The replacement’s own first check-in, which found its previous row |
Started with a new instance id ( |
9.7 s |
The new node’s check-in once the dead node’s row was late by the rule above |
Source: JobStoreSupport source at v2.5.2 (findFailedInstances, findOrphanedFailedInstances). Measured with bookshelf.PodNameInstanceIdGenerator and the environment variable POD_NAME, one run each.
That is the argument for stable ids on Kubernetes, discussed under Kubernetes; it also means that two live nodes must never share an id, because the second to start would "recover" the first one’s running jobs.
Stopping a node cleanly
kill -9 is the worst case; what a normal stop does depends on spring.quartz.wait-for-jobs-to-complete-on-shutdown (default false), which Spring’s SchedulerFactoryBean passes to Scheduler.shutdown(boolean) when the application context closes. Each setting was run with a SIGTERM to a JVM that was executing the 25-second requestsRecovery job, with a second node waiting:
| Observation | wait-for-jobs-to-complete-on-shutdown: false |
true |
|---|---|---|
Process exit after SIGTERM |
63 ms (exit code 143); the running job is simply cut off |
25.0 s: the JVM waited for the job |
Fired row of the job after exit |
Still there, state |
Gone, the job completed and was recorded |
Row of the stopped node in |
Left behind; the survivor removed it 11.1 s after the exit |
Left behind; the survivor removed it 9.1 s after the exit |
Job re-run by the survivor |
Yes, |
No, it had finished |
Source: Spring Boot: Quartz Scheduler and JobStoreSupport source at v2.5.2 (shutdown). The wait setting is documented on Listeners & Plugins, which also explains why ShutdownHookPlugin must not be added under Spring.
So a graceful stop never loses a job, and a stop that cuts a job off loses it unless the job requested recovery. Both leave the stopped node’s row behind for roughly ten seconds, harmlessly. The Kubernetes consequence (the grace period must exceed the longest job) is in that section.
Clock synchronisation
Quartz states the requirement bluntly: never run a cluster on separate machines unless their clocks are synchronised by a time-service daemon that runs very regularly, and the clocks must be within one second of each other. The reason is visible in the source. The check-in time written to QRTZ_SCHEDULER_STATE is the node’s own System.currentTimeMillis(), and the failure rule compares that value with the observer’s own clock. Fire times are computed by each node from its own clock too. Reasoned from the source, not run (the clocks of a laptop cannot be skewed safely), the effects are:
| Skew between two nodes | Effect |
|---|---|
An observer whose clock is ahead of the dead node’s by s |
Failed nodes are detected s earlier than the rule above; once s exceeds the 7500 ms grace, a live node that checks in on time looks late and is "recovered" while it is still running its jobs, so a recoverable job can run twice |
An observer whose clock is behind |
Detection is later by s; fail-over takes longer, nothing is wrong otherwise |
A node whose clock is ahead |
It considers triggers due earlier and wins the race for them more often, which makes the uneven distribution worse; its jobs run early by the skew |
Source: Quartz documentation: Configure Clustering with JDBC-JobStore and JobStoreSupport source at v2.5.2 (calcFailedIfAfter, clusterCheckIn)
In practice this means one time service (NTP or chrony) on every host or Kubernetes node, a monitor on the offset, and the same TZ in every container. Cluster nodes on one host or in one Kubernetes node share a clock and cannot disagree. The clocks of the database host do not matter to Quartz in the way the nodes' do, because the timestamps are written by the nodes, not by now() in SQL.
Never mix clustered and non-clustered nodes
Quartz warns never to start a non-clustered scheduler against tables that another scheduler is using, and predicts serious data corruption and erratic behaviour. The source shows the mechanism. A non-clustered job store runs recoverJobs() when the scheduler starts; it assumes it is alone, so it resets the world: every ACQUIRED and BLOCKED trigger of the scheduler name goes back to WAITING, COMPLETE triggers are removed, and every row of QRTZ_FIRED_TRIGGERS of that scheduler name is deleted, whichever node it belonged to. It recovers only the fired rows that carry its own instance id, which is NON_CLUSTERED. This was run: a clustered node was executing the 25-second recoverable job, a second JVM with the same scheduler name and isClustered=false was started, and then the first node was killed.
| Step | Observed |
|---|---|
Before the second JVM starts |
|
After it started ( |
|
The clustered node is killed with |
The survivor removed the dead node’s check-in row, found no fired rows to recover, and never re-ran the job. The recoverable job was silently lost |
Source: Quartz documentation: Configure Clustering with JDBC-JobStore and JobStoreSupport source at v2.5.2 (schedulerStarted, recoverJobs)
The same reset also moves the blocked triggers of a @DisallowConcurrentExecution job back to WAITING (the guard against a second concurrent run lives in those trigger states), so the cluster-wide "never overlaps" rule of Jobs & Job Data stops holding for as long as the damage lasts. The practical rules are: every process that starts a scheduler with a given scheduler name on shared tables must set isClustered=true; a one-off script, an integration test or a developer’s laptop must use another scheduler name, another table prefix or another database; and the Boot default of spring.quartz.job-store-type=memory (a RAM store never touches the tables) is the safe setting for processes that must not schedule. Giving a different scheduler name to a non-clustered scheduler is safe because every table carries SCHED_NAME; two clustered schedulers with different names simply form two independent logical clusters.
Tuning trigger acquisition
Three properties shape how triggers are acquired. They are all documented on the configuration pages, and all verified in QuartzSchedulerThread and JobStoreSupport:
| Property | Default | Meaning, read from the source |
|---|---|---|
|
|
If true the select-and-update of the acquisition runs while holding |
|
|
The scheduler thread asks for at most |
|
|
The store selects triggers due up to |
Source: Quartz documentation: Configure the scheduler, Quartz documentation: Configure JDBCJobStoreTX and QuartzSchedulerThread source at v2.5.2
spring:
  quartz:
    properties:
      org.quartz.scheduler.batchTriggerAcquisitionMaxCount: "6"
      org.quartz.scheduler.batchTriggerAcquisitionFireAheadTimeWindow: "4000"
org.quartz.jobStore.acquireTriggersWithinLock: "true"Two nodes, six one-shot triggers due at the same instant, six worker threads per node, three runs per setting, every run with the other Bookshelf jobs still firing:
| Setting | Executions per node in the three runs | Fire time minus scheduled time |
|---|---|---|
Default (batch 1, window 0) |
3 and 3, then 6 and 0, then 6 and 0 |
8 to 84 ms |
Batch 6, window 0, lock true |
6 and 0 in all three runs |
17 to 44 ms |
Batch 6, window 4000 ms, lock true |
6 and 0 in all three runs |
13 to 43 ms in one run; minus 3.3 s (fired more than three seconds before the scheduled time) in two runs |
Source: QuartzSchedulerThread source at v2.5.2. Single runs on one laptop; the scheduled time of the probe triggers was five seconds ahead and the early fires happened when a frequently firing Bookshelf trigger was acquired and the probes fell inside its four-second window.
That is the trade in numbers: a batch makes one node grab everything that is due, and a non-zero window makes triggers fire early, by more than three seconds here. Neither belongs in a service whose jobs are few and whose fire times matter (a nightly reminder at 02:00 must not run at 01:59:57); both exist for schedulers with thousands of triggers due at the same second, where acquisition itself is the bottleneck.
Scaling limits
Every acquisition-to-completion cycle of every fire passes through TRIGGER_ACCESS (at the latest at triggersFired and triggeredJobComplete), so the lock is a single serialisation point for the whole cluster. The Quartz documentation says that a cluster-wide lock of this kind degrades performance as nodes are added, beyond about three nodes and depending on the database. Nothing here was benchmarked; the figure is Quartz’s, not a measurement of this section. What follows from it:
-
Add nodes for availability, not for throughput: two or three nodes is the sweet spot, and the fire rate a cluster can sustain is bounded by the database’s row-lock throughput rather than by the number of worker threads.
-
Add threads and nodes for long-running and CPU-heavy jobs, where the time is in the job and the lock is touched twice per execution.
-
For thousands of short jobs, partition: run several distinct schedulers (distinct scheduler names, each possibly itself a small cluster for availability) and give each its own share of the jobs. The
SCHED_NAMEcolumn means they can share tables; the locks are per scheduler name, so partitions do not contend with each other. -
If the only requirement is "run this on one node at a time", with no job store, no fail-over of running jobs and no dynamic scheduling, a
@Scheduledmethod plus a lock is much lighter: see Scheduling & ShedLock and the comparison on Standard Scheduling vs Quartz. -
The connection pool has to cover the worker threads plus Quartz’s housekeeping threads on every node (the pool arithmetic is on Job Stores & Persistence and Production & Best Practices).
Clustering with the community NoSQL stores
MongoDB and Redis have no official Quartz job store. Two community projects exist (quartz-mongodb, mirrored as io.fluidsonic.mirror:quartz-mongodb:2.2.0-rc2, and net.joelinn:quartz-redis-jobstore:1.2.0), both advertise clustering, and both are broken on Quartz 2.5.x, the version that Spring Boot 4.1 and 3.5 manage. This was tested, including two-node clustered runs, and the result is the same in the single-node and the clustered case:
| Store | Quartz 2.5.2 | Quartz 2.4.1 (the last release before 2.5) |
|---|---|---|
|
Fails, both single and clustered: the scheduler starts and reports itself started, then the scheduler thread dies with |
Passes single and clustered (jobs fire, state survives a restart, no duplicates) |
|
Fails. With the Boot-managed Jedis 7.4.1 the application does not start ( |
Passes only with Jedis 3.3.0 (every later Jedis major tried fails with a |
Source: this section’s verification of both stores (the full matrix and the failure output are on Quartz with MongoDB and Quartz with Redis), quartz-mongodb (archived) and quartz-redis-jobstore
Even when they work they cluster differently from the JDBC store: they do not use QRTZ_LOCKS or QRTZ_SCHEDULER_STATE; the MongoDB store keeps its own lock and scheduler documents and the Redis store has no isClustered switch (the property setter does not exist, a cluster is formed by giving every node instanceId=AUTO), its heartbeat is written only when triggers are acquired, and it has no equivalent of requestsRecovery: a job running on a dead node is never re-fired, its trigger is only released by a later sweep. The honest advice is the one of the MongoDB page: keep Quartz on a small SQL database (clustered as on this page) and keep the application’s data in MongoDB or Redis, or use @Scheduled with ShedLock, whose lock providers cover both when only single execution is needed. The other NoSQL stores on this site (Couchbase, Neo4j, Elasticsearch) have no Quartz store at all.
Terracotta clustering is gone
Quartz once clustered through the TerracottaJobStore. It was removed in Quartz 2.4.0: the 2.3.2 jar contains eight Terracotta classes, the 2.4.1 and 2.5.2 jars none (the comparison is on Job Stores & Persistence), so JDBC is the only clustering mechanism in 2.5.2. Some pages of the official 2.5.x documentation still describe it (the Lesson 11 text that this page cites says clustering "currently works with the JDBC-Jobstore … and the TerracottaJobStore", and the configuration index still lists a Terracotta page); that is stale text, not a feature. The StdSchedulerFactory of 2.5.2 still contains a branch for job stores whose class name starts with org.terracotta.quartz, which can never be taken without that class. If you meet org.terracotta.quartz.TerracottaJobStore in an old configuration, the migration is to a JDBC job store: see Migration & What’s Changed.
Running the cluster on Kubernetes
A cluster on Kubernetes is a Deployment (or StatefulSet) of several replicas of the service, all pointing at one database. Nothing about Quartz needs to know about Kubernetes except two things: the instance id must be unique per pod, and a pod must be given time to finish its jobs. The workload objects themselves are on ReplicaSets & Deployments and StatefulSets, the termination sequence on Health Probes & Lifecycle. Whether the work should be a Quartz cluster at all, or a Kubernetes CronJob, is the question of Jobs & CronJobs: the CronJob is the better answer for a job that is a separate batch process; a Quartz cluster is the better answer for dynamic schedules, persistence in the application’s own database, and job code that is part of the service.
Pod names as instance ids
The hostname of a pod defaults to its name (see Pods), so plain AUTO already produces <pod name><epoch millis>: unique, and different at every restart. A stable, readable id needs one of three things, all run:
package bookshelf;

import org.quartz.SchedulerException;
import org.quartz.spi.InstanceIdGenerator;

/** Uses the pod name (env POD_NAME from the downward API, else the HOSTNAME that Kubernetes sets to the pod name) as the Quartz instance id. */
public class PodNameInstanceIdGenerator implements InstanceIdGenerator {

    @Override
    public String generateInstanceId() throws SchedulerException {
        String id = System.getenv("POD_NAME");
        if (id == null || id.isBlank()) {
            id = System.getenv("HOSTNAME");
        }
        if (id == null || id.isBlank()) {
            throw new SchedulerException("Neither POD_NAME nor HOSTNAME is set; cannot derive a unique instance id");
        }
        return id.trim();
    }
}
Source: Quartz API: InstanceIdGenerator and Kubernetes: Expose Pod Information to Containers Through Environment Variables
The generator is switched on by AUTO together with the instanceIdGenerator.class property. This block was run with the environment variables POD_NAME, DB_URL, DB_USER and DB_PASSWORD set and nothing else, as two JVMs (their ids were bookshelf-0 and bookshelf-1, and both rows were in QRTZ_SCHEDULER_STATE):
spring:
  datasource:
    url: ${DB_URL:jdbc:postgresql://localhost:5432/bookshelf}
    username: ${DB_USER:bookshelf}
    password: ${DB_PASSWORD}
  quartz:
    job-store-type: jdbc
    scheduler-name: BookshelfCluster
    wait-for-jobs-to-complete-on-shutdown: true
    jdbc:
      initialize-schema: never
    properties:
      org.quartz.scheduler.instanceId: AUTO
      org.quartz.scheduler.instanceIdGenerator.class: bookshelf.PodNameInstanceIdGenerator
      org.quartz.jobStore.driverDelegateClass: org.quartz.impl.jdbcjobstore.PostgreSQLDelegate
      org.quartz.jobStore.isClustered: "true"
org.quartz.threadPool.threadCount: "10"The two other ways, both also run, need no class: org.quartz.scheduler.instanceId: SYS_PROP with the JVM option -Dorg.quartz.scheduler.instanceId=${POD_NAME} (a third node started this way registered as bookshelf-sysprop), and org.quartz.scheduler.instanceIdGenerator.class: org.quartz.simpl.HostnameInstanceIdGenerator, which in a pod is the pod name. Putting the variable straight into spring.quartz.properties.* through relaxed binding of an environment variable is awkward because the keys contain dots; keep those keys in application.yaml (or a mounted ConfigMap) and use the environment only for secrets and for POD_NAME.
Deployment or StatefulSet
The choice is a trade between two behaviours that were measured above:
| Workload | Ids | Consequence for the cluster |
|---|---|---|
Deployment |
Random pod names; a replaced pod gets a new name |
A killed pod is recovered by another node after the 7.5 s grace plus the check-in cycle (9.7 s measured with a 2 s interval); every rollout leaves one stale |
StatefulSet |
Stable ordinals |
A restarted pod recovers its own jobs at its first check-in (1.9 s measured); the stale rows do not accumulate. The price is a StatefulSet’s ordered rollout and slower scaling, and that a pod that stays down keeps its row until another node declares it failed |
Source: Kubernetes: StatefulSets and Kubernetes: Deployments
A Deployment is the right default, because the stateless service that happens to schedule work stays a Deployment and the recovery by a neighbour is fast enough for jobs that take minutes. A StatefulSet is worth it only for fail-over of short, frequent recoverable jobs, where waiting ten seconds for a neighbour matters.
apiVersion: apps/v1
kind: Deployment
metadata:
  name: bookshelf
spec:
  replicas: 3                                  # about three nodes is the useful maximum for one Quartz cluster
  selector:
    matchLabels: {app: bookshelf}
  strategy:
    type: RollingUpdate
    rollingUpdate: {maxUnavailable: 1, maxSurge: 1}
  template:
    metadata:
      labels: {app: bookshelf}
    spec:
      terminationGracePeriodSeconds: 120       # longer than the longest job, see below
      containers:
        - name: bookshelf
          image: registry.example.com/bookshelf:1.0.0
          env:
            - name: POD_NAME
              valueFrom:
                fieldRef: {fieldPath: metadata.name}
            - name: DB_URL
              value: jdbc:postgresql://postgres.bookshelf.svc:5432/bookshelf
            - name: DB_USER
              valueFrom:
                secretKeyRef: {name: bookshelf-db, key: username}
            - name: DB_PASSWORD
              valueFrom:
                secretKeyRef: {name: bookshelf-db, key: password}
          readinessProbe:
            httpGet: {path: /actuator/health/readiness, port: 8080}
Source: Kubernetes: Deployments and Kubernetes: Expose Pod Information to Containers Through Environment Variables
The manifest is a sketch for orientation, not something applied or validated against a cluster here, and the image, the Secret and the service names are placeholders. The part that was verified is the application side: with only POD_NAME, DB_URL, DB_USER and DB_PASSWORD in the environment, the configuration above started two clustered nodes (bookshelf-0 and bookshelf-1), and one of them ran the 25-second job.
Graceful shutdown
When a pod is deleted Kubernetes sends SIGTERM, waits up to terminationGracePeriodSeconds (default 30), and then sends SIGKILL. Spring closes the context on SIGTERM and the scheduler is shut down as described above. Three rules follow, each backed by the measurements of the shutdown table:
-
Set
spring.quartz.wait-for-jobs-to-complete-on-shutdown: true, otherwise a SIGTERM cuts the running job off at once (63 ms in the measurement). Withtruethe JVM stayed up for the whole 25 seconds of the job and the job was recorded as complete, so no recovery was needed. The YAML above was run with a pod-name node and a 25-second job: the node exited 25.0 s after SIGTERM. This holds for Quartz’s ownSimpleThreadPool: with a SpringTaskExecutoras the thread pool the flag is not honoured, andspring.task.execution.shutdown.await-termination=truekeeps the JVM alive until the job ends but Quartz has already shut its job store down, so the completion is not recorded, the fired row staysEXECUTINGand a surviving node re-runs arequestsRecoveryjob (see Production & Best Practices: Graceful shutdown and Spring Boot Configuration). -
Set
terminationGracePeriodSecondsabove the longest job plus the Spring shutdown time, or Kubernetes sends SIGKILL in the middle of it and you are back to the crash case of the fail-over section. A job that is longer than any grace period you are willing to give must be a recoverable, idempotent job, or must be split. -
While a node is shutting down, it stops acquiring new triggers at once (the scheduler thread halts first) and only the running jobs continue; the other replicas keep firing. A rolling update therefore never stops the schedule, and the old pod’s stale row is removed by a neighbour roughly ten seconds later.
The rest of the termination sequence (the preStop hook, endpoint removal and why a short sleep helps HTTP traffic) concerns the web side and is on Health Probes & Lifecycle. Rolling update tuning is on Deployment Strategies, and scaling replicas on Autoscaling: do not let a horizontal autoscaler add replicas to a Quartz cluster to gain throughput, because of the scaling limit above; scale the worker threads and keep three nodes.
Quartz Example 13
Quartz ships a clustering example in the repository under examples/src/main/java/org/quartz/examples/example13 (read at tag v2.5.2, not run as it stands because it needs a prepared database and two terminals). It is the closest thing to an official reference and worth reading next to this page:
-
ClusterExampleis amainclass. It creates a scheduler withnew StdSchedulerFactory(), which readsquartz.propertiesfrom the classpath or from the file named by theorg.quartz.propertiessystem property (the example’s resources are calledinstance1.propertiesandinstance2.properties, so each node is pointed at one of them). With the argumentclearJobsit first callssched.clear(), and withdontScheduleJobsit only starts the scheduler, which is how the second node is started. Otherwise it schedules five jobs (job_1tojob_5), each in a group named after the node’s instance id, each withrequestRecovery()and a trigger that repeats 20 times (every 5, 5, 3, 4 and 4.5 seconds), starts the scheduler and sleeps for an hour. -
SimpleRecoveryJoblogs whether it isRECOVERINGor starting, sleeps ten seconds so there is time to kill the node, and increments a counter in itsJobDataMap.SimpleRecoveryStatefulJobextends it with@PersistJobDataAfterExecutionand@DisallowConcurrentExecution, so the counter survives and the job never overlaps with itself. -
instance1.propertiesandinstance2.propertiesconfigure the two nodes: scheduler nameTestScheduler, fixed instance idsinstance_oneandinstance_two(notAUTO), five threads,JobStoreTXwithPostgreSQLDelegate, a named data source with its own pool, andisClustered=true; the check-in interval is left at its default. The credentials in the file are the example’s own placeholders for a local database; use your own, and never ship them.
It teaches the operational experiment: start both nodes, watch which node logs each job, kill one while a job sleeps, and watch the other log RECOVERING after the detection time. It differs from this page’s setup in three ways: plain Quartz instead of Spring (so the pool, the transactions and the job factory are configured by hand), fixed ids set per properties file instead of AUTO, and a job store (JobStoreTX) that manages its own transactions instead of Boot’s LocalDataSourceJobStore. The cluster behaviour is the same, and so is the lesson: mark the jobs that must survive a crash with requestRecovery.
Source: ClusterExample.java at v2.5.2, the example13 resources at v2.5.2 and Quartz documentation: Configure Clustering with JDBC-JobStore
Worked example: the three-node Bookshelf cluster
The weekly statistics report of Bookshelf is the job that most needs clustering: it takes a long time, must not run twice at once, and must be re-run if its node dies. Three Bookshelf nodes share one PostgreSQL database with the configuration of the Kubernetes section. The job is written so that a second run is harmless:
package bookshelf;

import java.time.DayOfWeek;
import java.time.LocalDate;
import java.time.ZoneOffset;
import java.time.temporal.TemporalAdjusters;

import org.quartz.DisallowConcurrentExecution;
import org.quartz.JobExecutionContext;
import org.quartz.JobExecutionException;
import org.slf4j.Logger;
import org.slf4j.LoggerFactory;
import org.springframework.jdbc.core.JdbcTemplate;
import org.springframework.scheduling.quartz.QuartzJobBean;

@DisallowConcurrentExecution
public class WeeklyReportJob extends QuartzJobBean {

    private static final Logger log = LoggerFactory.getLogger(WeeklyReportJob.class);

    private final JdbcTemplate jdbc;

    public WeeklyReportJob(JdbcTemplate jdbc) {
        this.jdbc = jdbc;
    }

    @Override
    protected void executeInternal(JobExecutionContext context) throws JobExecutionException {
        // keyed by the week of the SCHEDULED time: a recovery run has the same scheduled time and hits the same row
        LocalDate week = context.getScheduledFireTime().toInstant().atZone(ZoneOffset.UTC).toLocalDate()
                .with(TemporalAdjusters.previousOrSame(DayOfWeek.MONDAY));
        String node = instanceId(context);

        String status = jdbc.query("SELECT status FROM weekly_report WHERE week_start = ?",
                rs -> rs.next() ? rs.getString(1) : null, week);
        if ("DONE".equals(status)) {
            log.info("Report for week {} is already DONE, nothing to do", week);
            return;
        }

        jdbc.update("""
                INSERT INTO weekly_report (week_start, status, attempts, node) VALUES (?, 'RUNNING', 1, ?)
                ON CONFLICT (week_start) DO UPDATE
                   SET status = 'RUNNING', attempts = weekly_report.attempts + 1, node = EXCLUDED.node
                """, week, node);

        generateStatistics(context.getMergedJobDataMap().getLongValueFromString("workMillis"));   // the long part

        jdbc.update("UPDATE weekly_report SET status = 'DONE', finished_at = now() WHERE week_start = ?", week);
    }

    private void generateStatistics(long workMillis) {
        try {
            Thread.sleep(workMillis);       // stands in for the real queries
        } catch (InterruptedException e) {
            Thread.currentThread().interrupt();
        }
    }

    private static String instanceId(JobExecutionContext context) {
        try {
            return context.getScheduler().getSchedulerInstanceId();
        } catch (org.quartz.SchedulerException e) {
            return "unknown";
        }
    }
}The table is weekly_report (week_start date PRIMARY KEY, status varchar(10), attempts int, node varchar(200), finished_at timestamptz). The job is declared with requestRecovery(true):
JobDetail report = JobBuilder.newJob(WeeklyReportJob.class)
        .withIdentity("weeklyReport", "bookshelf")
        .usingJobData("workMillis", "20000")
        .requestRecovery(true)                  // re-run if the node dies while it executes
        .storeDurably()
        .build();
Trigger sundayNight = TriggerBuilder.newTrigger()
        .forJob(report)
        .withIdentity("weeklyReportTrigger", "bookshelf")
        .withSchedule(CronScheduleBuilder.cronSchedule("0 0 3 ? * SUN"))
        .build();
scheduler.scheduleJob(report, sundayNight);The failure test ran the job (with an immediate one-shot trigger and 20 seconds of simulated work) on a node in its own JVM and killed that JVM with kill -9 in the middle, with a second node waiting:
| Moment | weekly_report and the cluster |
|---|---|
Before the kill |
One row: the week of 5 October 2026, status |
After the survivor recovered the job (31 s after the kill: about 10 s detection plus the report’s own 20 s of work) |
Still one row: status |
The two other checks of the three-node cluster were made with three separate JVMs against one container: the instance ids of bookshelf-0, bookshelf-1 and bookshelf-sysprop all appeared in QRTZ_SCHEDULER_STATE with their check-in interval, and both pod-name nodes held fired-trigger rows; and, from the section’s first cluster test, three schedulers of one JVM fired the one-second cache refresh 14 times and the two-second overdue-loan reminder 7 times with no scheduled time running twice. The monitoring of such a cluster (what to alert on: check-in age, recovered-job counts, QRTZ_FIRED_TRIGGERS rows that never disappear) is on Observability, and testing a cluster in CI on Testing.
Pitfalls
| Pitfall | What happens | What to do |
|---|---|---|
A non-clustered scheduler with the same name on the tables |
Its start-up recovery deletes every fired-trigger row, so a running recoverable job is never re-run after a crash (measured), and it frees blocked triggers (source) |
|
|
The second node recovers the first one’s running jobs at its first check-in (source) |
|
Expecting the cluster to share the load |
One node fires most or all of the work in the runs measured here |
Create several jobs or triggers, or partition by scheduler name; use the cluster for availability |
A recoverable job that is not idempotent |
After a crash it runs again from the beginning, possibly after partial side effects (measured: the report ran twice) |
Key the work on the scheduled time, upsert, check a completion marker |
A job without |
It is silently lost when its node dies; only the next fire time runs |
Declare it with |
Unsynchronised clocks |
Late or false fail-over (a skew above the 7.5 s grace can make a live node look dead), early or late fires (source) |
One time service on every host or Kubernetes node; monitor the offset |
Waiting for the 15000 ms default |
The documentation lists 15000, the code uses 7500, and the observed fail-over is 7.5 s to 22.5 s with the code’s default |
Set |
|
The pod is cut off in the middle of a job (63 ms in the measurement) |
|
Batch acquisition or a fire-ahead window "for performance" |
One node takes all the due triggers, triggers fire seconds early (3.3 s early measured) |
Leave |
Adding nodes to scale throughput |
The shared |
Add threads for long jobs; partition into several schedulers for many short ones |
A community NoSQL store as the cluster’s store |
MongoDB: nothing fires and nothing is reported; Redis: start-up failure (measured on 2.5.2) |
Quartz on SQL, MongoDB or Redis for the data, or ShedLock |
Three schedulers of one name in one JVM outside a test |
Spring registers the data source under the scheduler name, so the second overwrites the first (see the PostgreSQL page) |
One scheduler per JVM in production; separate JVMs when a test needs |
Looking for |
It was removed in 2.4.0 although some documentation pages still mention it |
Migrate to JDBC |
Source: this page’s measured results and the Quartz Best Practices.
What changed
| Release | Change |
|---|---|
Quartz 2.4.0 |
|
Quartz 2.5.0 |
Jakarta namespace and Java 11; |
Quartz 2.5.x scripts |
|
After Quartz 2.5.2 (unreleased on |
|
Quartz 2.5.2 versus the documentation |
The |
Spring Boot 3.5 to 4.x |
The Quartz auto-configuration moved to |
Spring Framework 6.2 to 7.0 |
|
Source: Quartz releases, Spring Boot 4.0 Migration Guide and this page’s measured results. The jar comparisons were made by listing the 2.3.2, 2.4.1 and 2.5.2 jars.
Where to go next
-
The locks and the cluster test of the reference database: Quartz on PostgreSQL.
-
What a missed fire does when a node was down: Misfires.
-
Jobs that must not overlap and job data that must survive: Jobs & Job Data.
-
All the
spring.quartz.*properties: Spring Boot Configuration for Quartz. -
Creating and changing schedules at run time on a cluster: Dynamic Scheduling & Management.
-
What to monitor in a cluster: Observability and Testing.
-
The production checklist: Production & Best Practices; upgrading and the collected documentation discrepancies: Migration & What’s Changed.
-
The one-page summary: Cheat Sheet and the section overview Scheduling.