Observability
|
This content was generated with the assistance of AI and should be verified against the official documentation before being relied on in production. The reference material consulted while preparing these pages is listed in the section bibliography. |
A resilience library that nobody can see working is a liability: a breaker that stays open for an hour, a retry that quietly
triples the load on a dependency, or a bulkhead that is always full all look like "the service is slow" until somebody
reads the right number. Resilience4j reports through four channels: Actuator endpoints (JSON, for a person with curl),
health indicators (for the platform), Micrometer meters (for Prometheus and Grafana) and events (for logs and your own
code). This page covers all four for every module, shows what each one looks like in a running service, and ends with alert
rules and the tracing-context question that the thread-pool bulkhead raises. It was written against Resilience4j 2.4.0,
Spring Boot 4.1.x, Spring Framework 7.0.x and Java 21 and verified on 4 October 2026. Every sample on the page is output from
a sample Spring Boot 4.1.1 application running on JDK 21, and the same run was repeated on Spring Boot 3.5.16 with
resilience4j-spring-boot3: the endpoint JSON, the HTTP status codes and every Prometheus metric name were identical. The
Boot 3 differences are in the section What changed recently.
The base setup of Actuator, Micrometer, the Prometheus registry and Micrometer Tracing is not repeated here; it is in
Metrics and Observability. This page adds only what is specific to
Resilience4j. The running example is Bookshelf in the package com.example.bookshelf: a pricing circuit breaker, an
isbn retry, rate limiter and semaphore bulkhead, a reviews time limiter, a recommendations thread-pool bulkhead and a
search timer. The sample outputs use the same instance names, and the code in the sample application was identical apart
from the package name.
The Bucket4j counterpart of this page (bucket listeners, Micrometer meters and backend health) is Bucket4j: Observability.
The four channels
| Channel | What you get | Who reads it | Switched on by |
|---|---|---|---|
Actuator endpoints |
The current state of every instance and the last 100 events per instance, as JSON. |
A person debugging, a script, a runbook. |
|
Health indicators |
|
A load balancer, a Kubernetes readiness probe, a status page. |
|
Micrometer meters |
Gauges, counters and timers per instance, with the tags |
Prometheus, Grafana, alerting. |
On by default when a |
Events |
One object per call outcome, state transition or rejection, delivered to a listener. |
Logs, audit trails, your own counters. |
Always available on every instance through |
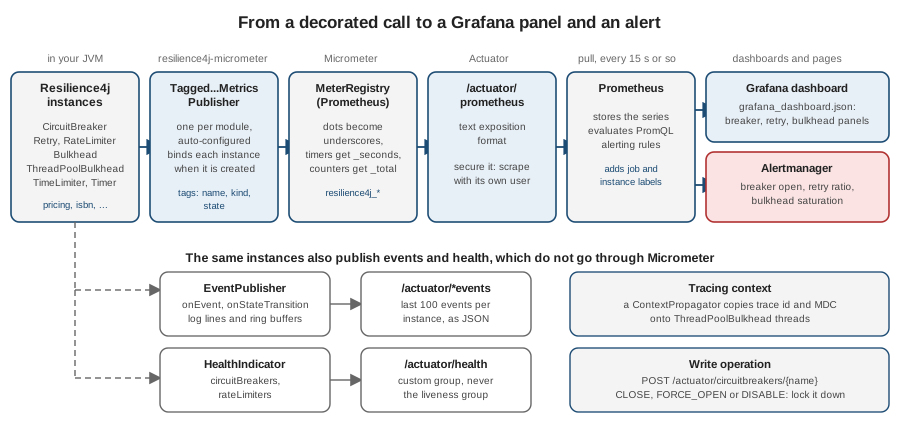
The figure shows how the first three channels connect. Metrics flow from the instances through the module’s metrics publisher
into the MeterRegistry, over the Actuator Prometheus endpoint to Prometheus, and from there to Grafana and Alertmanager.
Events and health take their own route and do not go through Micrometer at all.
Dependencies and the minimum configuration
With the starter from Getting Started in place, observability needs
two more things: the Actuator starter, which also brings Micrometer, and a Micrometer registry for the monitoring system. For
Prometheus that is micrometer-registry-prometheus.
<dependency>
    <groupId>org.springframework.boot</groupId>
    <artifactId>spring-boot-starter-actuator</artifactId>
</dependency>
<dependency>
    <groupId>io.micrometer</groupId>
    <artifactId>micrometer-registry-prometheus</artifactId>
</dependency>
Source: Spring Boot: Metrics and Micrometer: Prometheus. The Actuator starter is not a transitive dependency of the Resilience4j starters (their POMs pull in Micrometer and Spring only at runtime scope), so it has to be added explicitly. Without it the application starts, the annotations work and there are no endpoints and no meters.
Actuator endpoints are not exposed over HTTP by default, apart from health. The next block exposes the twelve
Resilience4j endpoints that this page walks through, the Prometheus scrape endpoint and health, shows health details, and
moves the whole management API onto its own port. The samples below were produced with the same endpoints, but on the
application port, with show-details: always and without the access line, so that every request could be made without
credentials.
management:
  server:
    port: 8081                       # management API on its own port, not reachable through the gateway
  endpoints:
    web:
      exposure:
        include: >-
          health,prometheus,
          circuitbreakers,circuitbreakerevents,
          retries,retryevents,
          ratelimiters,ratelimiterevents,
          bulkheads,bulkheadevents,
          timelimiters,timelimiterevents,
          timers,timerevents
  endpoint:
    health:
      show-details: when-authorized
    circuitbreakers:
      access: read-only              # no write operation unless an ops profile turns it on
  health:
    circuitbreakers:
      enabled: true
    ratelimiters:
      enabled: true
  metrics:
    tags:
      application: bookshelf         # the Grafana dashboard filters on this label
Source: Spring Boot: Endpoints. Putting the management
API on its own port was run: with management.server.port=0 and the same endpoints exposed, /actuator/circuitbreakers
answered 404 on the application port and 200 on the management port. The access property is explained in the section
The circuitbreakers write operation, and the individual keys of resilience4j.* are in
Spring Boot Configuration.
The Actuator endpoints
Each module that is on the classpath contributes a pair of endpoints: one that lists the instances and one that returns the
buffered events. Every endpoint id below is the literal @Endpoint(id = …) of the v2.4.0 resilience4j-spring-boot4
sources, and an endpoint exists only when it is exposed (@ConditionalOnAvailableEndpoint).
| Endpoint id | Paths under /actuator |
What it returns |
|---|---|---|
|
|
Every breaker with its state, rates and counters. The POST is the write operation. |
|
|
Buffered events of all breakers, of one breaker, or of one breaker filtered by event type. |
|
|
The names of the retries, and their buffered events. |
|
|
The names of the rate limiters, and their buffered events. |
|
|
The names of the semaphore and the thread-pool bulkheads, and their buffered events. |
|
|
The names of the time limiters, and their buffered events. |
|
|
The names of the |
|
|
A server-sent-events stream of breaker events. Needs Reactor on the classpath. See below. |
Only circuitbreakers shows details. The other …s endpoints return the instance names, because the interesting numbers
for those modules are meters, not endpoint fields. The …events endpoints return what the instance’s event consumer
buffer holds: a ring buffer per instance whose size is eventConsumerBufferSize (default 100). Old events are
overwritten, so these endpoints answer "what just happened", not "what happened last night", and an unknown instance name
returns an empty list rather than an error.
The samples come from this sequence: three successful pricing price calls, one isbn lookup that failed twice and then
succeeded on the third attempt (so the retry was used) next to one that succeeded at once, a fast reviews call and one that
timed out after 200 ms, a recommendations call on the thread pool, and two search calls, one of which threw. JSON is
reformatted for reading and lists are trimmed where noted; the values are as returned.
circuitbreakers
curl -s http://localhost:8081/actuator/circuitbreakers{
"circuitBreakers": {
"pricing": {
"bufferedCalls": 3,
"failedCalls": 0,
"failureRate": "-1.0%",
"failureRateThreshold": "50.0%",
"notPermittedCalls": 0,
"slowCallRate": "-1.0%",
"slowCallRateThreshold": "100.0%",
"slowCalls": 0,
"slowFailedCalls": 0,
"state": "CLOSED"
}
}
}Source: the output of the sample run and the
CircuitBreakerEndpoint at v2.4.0
(the rates are formatted by the endpoint as strings with a % suffix). A failure rate of -1.0% is not a bug: it means that
minimumNumberOfCalls has not been reached yet, so there is no rate to report. After a failing run the same breaker reads:
{
  "pricing": {
    "bufferedCalls": 4,
    "failedCalls": 2,
    "failureRate": "50.0%",
    "failureRateThreshold": "50.0%",
    "notPermittedCalls": 6,
    "slowCallRate": "0.0%",
    "slowCallRateThreshold": "100.0%",
    "slowCalls": 0,
    "slowFailedCalls": 0,
    "state": "OPEN"
  }
}
Source: the output of the sample run (a four-call window; two failures opened the breaker, the other six calls were
rejected). notPermittedCalls is the count of calls rejected by the open breaker; the window’s counters otherwise describe
only the calls that were allowed through.
circuitbreakerevents
curl -s http://localhost:8081/actuator/circuitbreakerevents/pricing/state_transition{
"circuitBreakerEvents": [
{
"circuitBreakerName": "pricing",
"creationTime": "2026-10-04T19:06:46.525534+02:00[Europe/Madrid]",
"durationInMs": null,
"errorMessage": null,
"stateTransition": "State transition from CLOSED to OPEN",
"type": "STATE_TRANSITION"
}
]
}Source: the output of the sample run and the
CircuitBreakerEvent.Type at v2.4.0.
The type segment is case-insensitive (state_transition is converted with toUpperCase()); the types are ERROR,
IGNORED_ERROR, SUCCESS, NOT_PERMITTED, STATE_TRANSITION, RESET, FORCED_OPEN, DISABLED, FAILURE_RATE_EXCEEDED
and SLOW_CALL_RATE_EXCEEDED. A SUCCESS event looks like the one above with "type": "SUCCESS", a durationInMs and no
stateTransition. Only STATE_TRANSITION and RESET are published in every state; the other types are published only while
the breaker is CLOSED, OPEN, HALF_OPEN or METRICS_ONLY (CircuitBreakerEvent.Type.forcePublish and
CircuitBreaker.State.allowPublish), so a breaker in FORCED_OPEN or DISABLED adds nothing to the buffer except the
transitions themselves, as noted on CircuitBreaker. The state
transition string is the toString() of the StateTransition enum on Spring Boot 4.1.1 (Jackson 3), as above, while the same
request on Spring Boot 3.5.16 (Jackson 2) returned the enum name CLOSED_TO_OPEN; do not parse that field in a script that has
to run on both.
retries and retryevents
curl -s http://localhost:8081/actuator/retries
curl -s http://localhost:8081/actuator/retryevents/isbn
{ "retries": ["isbn"] }{
"retryEvents": [
{ "creationTime": "2026-10-04T19:02:02.034527+02:00[Europe/Madrid]",
"errorMessage": "java.lang.IllegalStateException: isbn-api answered 503",
"numberOfAttempts": 1, "retryName": "isbn", "type": "RETRY" },
{ "creationTime": "2026-10-04T19:02:02.047671+02:00[Europe/Madrid]",
"errorMessage": "java.lang.IllegalStateException: isbn-api answered 503",
"numberOfAttempts": 2, "retryName": "isbn", "type": "RETRY" },
{ "creationTime": "2026-10-04T19:02:02.061764+02:00[Europe/Madrid]",
"errorMessage": "java.lang.IllegalStateException: isbn-api answered 503",
"numberOfAttempts": 2, "retryName": "isbn", "type": "SUCCESS" }
]
}Source: the output of the sample run. The types are RETRY (a failed attempt that will be repeated), SUCCESS (the call
succeeded after at least one retry), ERROR (it failed and the attempts ran out) and IGNORED_ERROR (an exception in
ignoreExceptions), from the
RetryEvent.Type at v2.4.0.
numberOfAttempts in the SUCCESS event is the number of retries that preceded the success, not the attempt number.
The lookup that succeeded at the first attempt published no retry event, which is why only three events appear for two calls.
ratelimiters and ratelimiterevents
curl -s http://localhost:8081/actuator/ratelimiters
curl -s http://localhost:8081/actuator/ratelimiterevents/isbn
{ "rateLimiters": ["isbn"] }{
"rateLimiterEvents": [
{ "creationTime": "2026-10-04T19:02:02.029621+02:00[Europe/Madrid]",
"rateLimiterName": "isbn", "type": "SUCCESSFUL_ACQUIRE" },
{ "creationTime": "2026-10-04T19:02:02.047499+02:00[Europe/Madrid]",
"rateLimiterName": "isbn", "type": "SUCCESSFUL_ACQUIRE" }
]
}Source: the output of the sample run (trimmed to two of the four events) and the
RateLimiterEvent.Type at v2.4.0.
The types are SUCCESSFUL_ACQUIRE, FAILED_ACQUIRE and DRAINED. The isbn limiter in the sample had
subscribeForEvents: true; the rate limiter is the only module where the event consumer is opt-in, so without that property
the endpoint returns an empty list. The retry sits outside the rate limiter, so every attempt takes a permit: the lookup that
needed three attempts and the one that needed one account for the four acquisitions.
bulkheads and bulkheadevents
curl -s http://localhost:8081/actuator/bulkheads
curl -s http://localhost:8081/actuator/bulkheadevents/recommendations
{ "bulkheads": ["isbn", "recommendations"] }{
"bulkheadEvents": [
{ "bulkheadName": "recommendations",
"creationTime": "2026-10-04T19:02:02.284988+02:00[Europe/Madrid]",
"type": "CALL_PERMITTED" },
{ "bulkheadName": "recommendations",
"creationTime": "2026-10-04T19:02:02.285302+02:00[Europe/Madrid]",
"type": "CALL_FINISHED" }
]
}Source: the output of the sample run. bulkheads lists the semaphore bulkhead isbn and the thread-pool bulkhead
recommendations together. The types, from
BulkheadEvent.Type at v2.4.0,
are CALL_PERMITTED, CALL_REJECTED and CALL_FINISHED. A CALL_REJECTED event is the only place where the bulkhead
records that it said no, because Resilience4j keeps no counter meter for rejections (see the meter tables below).
timelimiters and timelimiterevents
curl -s http://localhost:8081/actuator/timelimiters
curl -s http://localhost:8081/actuator/timelimiterevents/reviews
{ "timeLimiters": ["reviews"] }{
"timeLimiterEvents": [
{ "creationTime": "2026-10-04T19:02:02.077943+02:00[Europe/Madrid]",
"timeLimiterName": "reviews", "type": "SUCCESS" },
{ "creationTime": "2026-10-04T19:02:02.282019+02:00[Europe/Madrid]",
"timeLimiterName": "reviews", "type": "TIMEOUT" }
]
}Source: the output of the sample run. The types are SUCCESS, TIMEOUT and ERROR, from the
TimeLimiterEvent.Type at v2.4.0.
timers and timerevents
The timers endpoints belong to the @Timer annotation and the Timer class of resilience4j-micrometer: a decorator
that records how long a call took and whether it failed, with no state machine behind it. It is configured under
resilience4j.micrometer.timer.instances.<name> (keys metricNames, onFailureTagResolver and eventConsumerBufferSize),
and its meter is described in the section Micrometer meters.
curl -s http://localhost:8081/actuator/timers
curl -s http://localhost:8081/actuator/timerevents/search
{ "timers": ["search"] }{
"timerEvents": [
{ "creationTime": "2026-10-04T19:02:02.286383+02:00[Europe/Madrid]",
"operationDuration": null, "timerName": "search", "type": "START" },
{ "creationTime": "2026-10-04T19:02:02.286678+02:00[Europe/Madrid]",
"operationDuration": "PT0.000325792S", "timerName": "search", "type": "SUCCESS" },
{ "creationTime": "2026-10-04T19:02:02.286729+02:00[Europe/Madrid]",
"operationDuration": null, "timerName": "search", "type": "START" },
{ "creationTime": "2026-10-04T19:02:02.286923+02:00[Europe/Madrid]",
"operationDuration": "PT0.000075209S", "timerName": "search", "type": "FAILURE" }
]
}Source: the output of the sample run. The types are START, SUCCESS and FAILURE, and operationDuration is an ISO-8601
duration. The method that threw was annotated @Timer(name = "search"); the annotation is
io.github.resilience4j.micrometer.annotation.Timer
and the annotation name collides with java.util.Timer and Micrometer’s own io.micrometer.core.annotation.Timed, so
import it explicitly.
The event stream endpoint
streamcircuitbreakerevents (and the Hystrix-format hystrixstreamcircuitbreakerevents) are Actuator endpoints that
return Flux<ServerSentEvent<String>> with the content type text/event-stream, merged with a one-second heartbeat. They
are registered only when Reactor is on the classpath. In the sample application, which runs on Spring MVC, a request to
/actuator/streamcircuitbreakerevents/pricing did not produce a stream: it answered 503 without an Accept header and
404 with Accept: text/event-stream. The endpoint was therefore not verified on the servlet stack and the page does not
recommend it; the Javadoc in the source also still shows the old path stream-circuitbreaker-events. For a live feed on
Spring MVC, use the EventPublisher listeners described in the section Logging the event streams or poll
circuitbreakerevents.
Source: the
CircuitBreakerServerSideEvent at v2.4.0
and the sample run.
The circuitbreakers write operation
The circuitbreakers endpoint is the only Resilience4j endpoint with a write operation. POST /actuator/circuitbreakers/<name>
with a JSON body {"updateState": "<value>"} changes the state of that breaker. The operation accepts exactly three values:
CLOSE (transitionToClosedState()), FORCE_OPEN (transitionToForcedOpenState()) and DISABLE
(transitionToDisabledState()). The state machine side of these transitions is on
CircuitBreaker.
curl -s -X POST http://localhost:8081/actuator/circuitbreakers/pricing \
     -H 'Content-Type: application/json' \
     -d '{"updateState":"FORCE_OPEN"}'
curl -s -X POST http://localhost:8081/actuator/circuitbreakers/pricing \
     -H 'Content-Type: application/json' \
     -d '{"updateState":"CLOSE"}'
{"circuitBreakerName":"pricing","currentState":"FORCED_OPEN","message":"pricing state has been changed successfully"}{"circuitBreakerName":"pricing","currentState":"CLOSED","message":"pricing state has been changed successfully"}Source: the output of the sample run and the
CircuitBreakerEndpoint at v2.4.0.
DISABLE answered "currentState":"DISABLED". Three things about the operation surprised in the run, and each is a
reason to treat it carefully:
-
Any other value is rejected before the method runs:
OPENandHALF_OPENboth returned400 Bad Request, because the body is bound to an enum with only those three constants. There is no way to open a breaker "naturally" or to force it half-open over HTTP. -
The name is not checked. Posting
{"updateState":"CLOSE"}to/actuator/circuitbreakers/nosuchreturned200with"currentState":"CLOSED"and created a breaker namednosuchwith the default configuration, which then appeared in/actuator/circuitbreakers, in the health indicator if the default config registers it, and as a new set of series in Prometheus. A typo in a runbook command creates a permanent, empty instance. -
A body-less request is rejected with
415 Unsupported Media Type; theContent-Type: application/jsonheader is required.
FORCE_OPEN and DISABLE change production behaviour with one request: a forced-open breaker rejects every call until
somebody posts CLOSE, and a disabled breaker lets everything through and stops recording. That makes the endpoint a
control plane and not a monitoring page, so it needs three layers of protection.
Layer 1: take the write operation away
Since Spring Boot 3.4 the access level of an endpoint is set with management.endpoint.<id>.access, which replaces the
older enabled property. The values are none, read-only and unrestricted. With read-only, the GET stays and the
POST is not registered.
management:
  endpoint:
    circuitbreakers:
      access: read-only
Source: Spring Boot: Endpoints (endpoint access). In
the run, with access=read-only, GET /actuator/circuitbreakers returned 200 and the same POST returned 404: the
write operation does not exist at all. Keep read-only as the default, and turn it to unrestricted only in a profile that
operators use, if at all.
Layer 2: keep the management API off the public network
management.server.port (shown earlier) moves every endpoint to a second port, and management.server.address binds it to
one interface. In the run the application port answered 404 for /actuator/circuitbreakers and the management port
answered 200. The gateway, the ingress and the public load balancer should route only to the application port; reach the
management port through a Service that is not exposed, a port-forward, or a network policy that admits only the monitoring
namespace.
Layer 3: authenticate and authorize
Even on a private port the write operation should need a role, and a monitoring user (Prometheus, Grafana) should not have it. A Spring Security filter chain that matches the Actuator endpoints can express "everybody authenticated reads, only ops writes". The password comes from the environment and is never in the file.
package com.example.bookshelf.config;

import org.springframework.beans.factory.annotation.Value;
import org.springframework.boot.security.autoconfigure.actuate.web.servlet.EndpointRequest;
import org.springframework.context.annotation.Bean;
import org.springframework.context.annotation.Configuration;
import org.springframework.core.annotation.Order;
import org.springframework.http.HttpMethod;
import org.springframework.security.config.Customizer;
import org.springframework.security.config.annotation.web.builders.HttpSecurity;
import org.springframework.security.config.http.SessionCreationPolicy;
import org.springframework.security.core.userdetails.User;
import org.springframework.security.core.userdetails.UserDetailsService;
import org.springframework.security.crypto.factory.PasswordEncoderFactories;
import org.springframework.security.provisioning.InMemoryUserDetailsManager;
import org.springframework.security.web.SecurityFilterChain;

@Configuration
class ActuatorSecurityConfig {

    @Bean
    @Order(1)
    SecurityFilterChain actuatorSecurity(HttpSecurity http) throws Exception {
        return http
            .securityMatcher(EndpointRequest.toAnyEndpoint())
            .authorizeHttpRequests(auth -> auth
                .requestMatchers(EndpointRequest.to("health")).permitAll()
                .requestMatchers(HttpMethod.POST, "/actuator/circuitbreakers/**").hasRole("OPS")
                .anyRequest().hasAnyRole("OPS", "OBSERVER"))
            .httpBasic(Customizer.withDefaults())
            .sessionManagement(s -> s.sessionCreationPolicy(SessionCreationPolicy.STATELESS))
            .csrf(csrf -> csrf.disable())      // stateless, header-authenticated management API
            .build();
    }

    @Bean
    UserDetailsService actuatorUsers(@Value("${ACTUATOR_PASSWORD}") String password) {
        var encoder = PasswordEncoderFactories.createDelegatingPasswordEncoder();
        return new InMemoryUserDetailsManager(
            User.withUsername("ops").password(encoder.encode(password)).roles("OPS").build(),
            User.withUsername("grafana").password(encoder.encode(password)).roles("OBSERVER").build());
    }
}
Source: Spring Boot: Endpoints (securing HTTP endpoints). In
the run, with ACTUATOR_PASSWORD supplied as a system property: /actuator/health was reachable without credentials,
/actuator/circuitbreakers returned 401 without them, the grafana user got 200 for GET /actuator/circuitbreakers,
/actuator/retries and /actuator/prometheus, the same user got 403 for the POST, and the ops user got 200 with
"currentState":"FORCED_OPEN". Two details matter. The POST rule has to be written with HttpMethod.POST and a path
matcher, because EndpointRequest.to("circuitbreakers") matches the endpoint for every method. And the example uses one
shared secret for two users only to stay short; in production give each consumer its own credential, from a secret store,
and prefer a token-based scheme (OAuth2 resource server, mutual TLS) over basic authentication. The Prometheus scrape
configuration later on this page shows the monitoring user’s password being read from a mounted file.
On Spring Boot 3 the matcher class is org.springframework.boot.actuate.autoconfigure.security.servlet.EndpointRequest; the
rest of the example is unchanged.
Health indicators
Resilience4j contributes two health indicators to /actuator/health: circuitBreakers and rateLimiters. There is no
bulkhead, retry or time limiter indicator: those modules have no "unhealthy" condition that a health check could
meaningfully report. A health indicator has to be enabled twice: once for the indicator as a whole and once for each
instance that should appear in it.
management:
  health:
    circuitbreakers:
      enabled: true
    ratelimiters:
      enabled: true
resilience4j:
  circuitbreaker:
    configs:
      default:
        registerHealthIndicator: true
    instances:
      pricing:
        baseConfig: default
      pricingStrict:
        baseConfig: default
        allowHealthIndicatorToFail: true
  ratelimiter:
    instances:
      isbn:
        registerHealthIndicator: true
Source: Resilience4j: Spring Boot 2 & 3 and the
CircuitBreakersHealthIndicatorAutoConfiguration at v2.4.0.
The management.health.circuitbreakers.enabled and management.health.ratelimiters.enabled properties are
@ConditionalOnProperty without a default: if they are absent, the indicator bean does not exist and nothing appears in the
health response, whatever registerHealthIndicator says. registerHealthIndicator defaults to false per instance, and the
indicator lists only instances where it is true; putting it in configs.default makes every instance that inherits the
default configuration, including breakers created later by name, appear. The pricingStrict instance in the sample is a
second breaker with allowHealthIndicatorToFail: true, to show the difference below.
What each state reports
For the circuit breaker the mapping is in CircuitBreakersHealthIndicator.mapBackendMonitorState. CLOSED is UP. OPEN
is the custom status CIRCUIT_OPEN, or DOWN when the instance has allowHealthIndicatorToFail: true. HALF_OPEN is the
custom status CIRCUIT_HALF_OPEN, and allowHealthIndicatorToFail does not change it. Every other state (DISABLED,
METRICS_ONLY, FORCED_OPEN) is UNKNOWN. The details of each instance are the numbers of the circuitbreakers endpoint.
The rate limiter indicator reports UP while a permission is available or nobody is waiting, RATE_LIMITED (or DOWN with
allowHealthIndicatorToFail) when no permission is available and the wait would exceed timeoutDuration, and UNKNOWN
otherwise; its details are availablePermissions and numberOfWaitingThreads.
FORCED_OPEN"] end subgraph status["Health status of the instance"] UP[UP] CO[CIRCUIT_OPEN] DN[DOWN] CH[CIRCUIT_HALF_OPEN] UK[UNKNOWN] end CL --> UP OP -->|"allowHealthIndicatorToFail false
(the default)"| CO OP -->|"allowHealthIndicatorToFail true"| DN HO --> CH OT --> UK DN --> H503["HTTP 503
top level DOWN"] CO --> H200["HTTP 200
top level stays UP"] CH --> H200 UK --> H200 UP --> H200 classDef ok fill:#e3f1e3,stroke:#2f7a2f,color:#222 classDef warn fill:#fff4d6,stroke:#b07a00,color:#222 classDef bad fill:#fbe3e3,stroke:#b03030,color:#222 class UP,H200 ok class CO,CH,UK warn class DN,H503 bad
curl -s http://localhost:8081/actuator/health/circuitBreakers{
"status": "UP",
"details": {
"pricing": {
"status": "CIRCUIT_OPEN",
"details": {
"failureRate": "50.0%", "failureRateThreshold": "50.0%",
"slowCallRate": "0.0%", "slowCallRateThreshold": "100.0%",
"bufferedCalls": 4, "slowCalls": 0, "slowFailedCalls": 0,
"failedCalls": 2, "notPermittedCalls": 6, "state": "OPEN"
}
},
"pricingStrict": {
"status": "UP",
"details": { "failureRate": "-1.0%", "state": "CLOSED", "...": "..." }
}
}
}Source: the output of the sample run (the pricingStrict details are shortened). The aggregate in the run behaved like this,
which is the part that surprises people: with only pricing open, the circuitBreakers component was UP and the
service answered 200; when pricingStrict was also opened, the component was DOWN and /actuator/health answered 503;
with pricing half-open and pricingStrict open it was still DOWN; and with pricing forced open (UNKNOWN) and
pricingStrict open it was DOWN. Spring Boot’s default StatusAggregator orders DOWN, OUT_OF_SERVICE, UP and UNKNOWN and ignores any other status, so the
custom statuses CIRCUIT_OPEN and CIRCUIT_HALF_OPEN never make the aggregate worse (a component whose instances are all
custom statuses aggregates to UNKNOWN). That is the point of
the custom statuses: they let an open breaker be visible in the details without turning the service DOWN, because a
service with one broken dependency and a working fallback is degraded, not dead. Use allowHealthIndicatorToFail: true only
for a breaker whose dependency the service cannot do its job without.
An indicator that is enabled while the health endpoint is not exposed stops the application from starting. The run with
management.endpoints.web.exposure.include set to circuitbreakers only and
management.health.circuitbreakers.enabled=true failed with a missing bean of type
org.springframework.boot.health.actuate.endpoint.StatusAggregator, because the health endpoint’s configuration, which
provides that bean, is conditional on the endpoint being available. Expose health whenever the indicator is enabled.
Health groups, and keeping the indicators out of liveness
Spring Boot health groups select which indicators answer a given URL: /actuator/health/<group>. They are the right way to
use Resilience4j’s indicators. A custom group gives an operator or a status page the dependency view without touching what
the platform probes.
management:
  endpoint:
    health:
      group:
        dependencies:
          include: circuitBreakers,rateLimiters
          show-details: never
        readiness:
          include: readinessState
Source: Spring Boot: Health groups. In the run,
/actuator/health/dependencies with pricingStrict open answered 503 {"status":"DOWN"} and the readiness group
answered 200.
The liveness probe answers one question: "is this process stuck so badly that restarting it is the cure?" An open breaker
means that a dependency is unhealthy, and restarting the caller does not fix a dependency. Worse, every replica of
bookshelf-service sees the same open breaker at about the same time, so a liveness probe that includes circuitBreakers
makes Kubernetes restart the whole deployment, which empties the breaker state, reconnects every pool at once and adds a
thundering herd to the outage. In the run, a configuration that added circuitBreakers to the liveness group made
/actuator/health/liveness answer 503 as soon as a strict breaker opened. Keep circuitBreakers and rateLimiters out of
liveness, leave readiness with readinessState, and add the indicators to readiness only for a dependency that the
service genuinely cannot serve without (and then with allowHealthIndicatorToFail), accepting that the instance leaves the
load balancer while the breaker is open. The probe mechanics, timings and the Spring Boot group configuration are covered in
Health Probes and Lifecycle.
Micrometer meters
When a MeterRegistry bean exists, every module’s auto-configuration registers a Tagged…MetricsPublisher that binds the
meters of each instance as it is created, so breakers created later by name get meters too. All the meter names below are the
constants of the …MetricNames classes in resilience4j-micrometer at v2.4.0, and each tag was checked against
/actuator/prometheus in the sample run. Micrometer names use dots; the Prometheus registry rewrites them:
-
dots become underscores;
-
a
Timerbecomes asummarywith_seconds_count,_seconds_sumand a separate_seconds_maxgauge (and_bucketseries when histograms are switched on); -
a counter, including the
FunctionCounterthat the retry module uses, gets the suffix_total; -
a gauge keeps its name.
Every meter carries the tag name (the instance name), any registry tags, and the per-module tags in the tables. A tag that
is a label of every series in Prometheus is also what by (name) aggregations in the alert rules use.
CircuitBreaker (prefix resilience4j.circuitbreaker)
| Micrometer name | Type | Tags besides name |
Prometheus series |
|---|---|---|---|
|
Timer |
|
|
|
Counter |
|
|
|
Gauge |
|
|
|
Gauge |
|
|
|
Gauge |
|
|
|
Gauge |
none |
|
|
Gauge |
none |
|
Retry (prefix resilience4j.retry)
| Micrometer name | Type | Tags besides name |
Prometheus series |
|---|---|---|---|
|
FunctionCounter |
|
|
The retry counter counts calls by outcome, not attempts: a call that failed twice and then succeeded adds one to
successful_with_retry. failed_without_retry is a call that failed with an exception the retry does not handle, such as one
in ignoreExceptions, and failed_with_retry is a call that used all its attempts and gave up.
RateLimiter (prefix resilience4j.ratelimiter)
| Micrometer name | Type | Tags besides name |
Prometheus series |
|---|---|---|---|
|
Gauge |
none |
|
|
Gauge |
none |
|
Bulkhead and ThreadPoolBulkhead (prefix resilience4j.bulkhead)
Both bulkhead kinds share the prefix, and both are gauges with only the name tag; the semaphore bulkhead has two, the
thread-pool bulkhead seven.
| Micrometer name | Kind | Prometheus series |
|---|---|---|
|
semaphore |
|
|
semaphore |
|
|
thread pool |
|
|
thread pool |
|
|
thread pool |
|
|
thread pool |
|
|
thread pool |
|
|
thread pool |
|
|
thread pool |
|
TimeLimiter (prefix resilience4j.timelimiter)
| Micrometer name | Type | Tags besides name |
Prometheus series |
|---|---|---|---|
|
Counter |
|
|
Timer (default name resilience4j.timer.calls)
| Micrometer name | Type | Tags besides name |
Prometheus series |
|---|---|---|---|
|
Timer |
|
With |
The failure tag is produced by onFailureTagResolver, a Function<Throwable, String> that is configured as a class name
(resilience4j.micrometer.timer.instances.<name>.onFailureTagResolver). The default is the simple class name, so an
application that throws exceptions with unbounded class names (generated proxies, for example) creates unbounded tag values.
A real scrape
# TYPE resilience4j_circuitbreaker_calls_seconds summary
resilience4j_circuitbreaker_calls_seconds_count{kind="failed",name="pricing"} 2
resilience4j_circuitbreaker_calls_seconds_sum{kind="failed",name="pricing"} 5.3791E-5
resilience4j_circuitbreaker_calls_seconds_count{kind="successful",name="pricing"} 3
# TYPE resilience4j_circuitbreaker_not_permitted_calls_total counter
resilience4j_circuitbreaker_not_permitted_calls_total{kind="not_permitted",name="pricing"} 6.0
# TYPE resilience4j_circuitbreaker_state gauge
resilience4j_circuitbreaker_state{name="pricing",state="closed"} 1.0
resilience4j_circuitbreaker_state{name="pricing",state="open"} 0.0
resilience4j_circuitbreaker_state{name="pricingStrict",state="open"} 1.0
# TYPE resilience4j_retry_calls_total counter
resilience4j_retry_calls_total{kind="successful_with_retry",name="isbn"} 1.0
resilience4j_retry_calls_total{kind="successful_without_retry",name="isbn"} 1.0
# TYPE resilience4j_timelimiter_calls_total counter
resilience4j_timelimiter_calls_total{kind="timeout",name="reviews"} 1.0
resilience4j_timelimiter_calls_total{kind="successful",name="reviews"} 1.0
# TYPE resilience4j_ratelimiter_available_permissions gauge
resilience4j_ratelimiter_available_permissions{name="isbn"} 46.0
# TYPE resilience4j_bulkhead_available_concurrent_calls gauge
resilience4j_bulkhead_available_concurrent_calls{name="isbn"} 5.0
# TYPE resilience4j_bulkhead_queue_depth gauge
resilience4j_bulkhead_queue_depth{name="recommendations"} 0.0
# TYPE bookshelf_search_calls_seconds summary
bookshelf_search_calls_seconds_count{failure="IllegalArgumentException",kind="failed",name="search"} 1
bookshelf_search_calls_seconds_count{kind="successful",name="search"} 1
Source: the /actuator/prometheus response of the sample run through PrometheusMeterRegistry (Micrometer 1.17.1; the
series are a selection, and the pricing breaker was closed again by the last write-operation call, which is why state="closed"
is 1.0 while pricingStrict is still open). 46.0 available permissions is the isbn limiter’s limitForPeriod of 50
minus the four acquisitions. The HELP line of a Prometheus family is taken from the first meter registered under that name,
so resilience4j_circuitbreaker_calls_seconds carries the text "Total number of failed calls" even for the successful
series, and resilience4j_retry_calls_total carries the text of its first kind; read the kind tag, not the help text.
Controlling the meters
-
Switch a module’s meters off:
resilience4j.circuitbreaker.metrics.enabled=false(likewiseretry,ratelimiter,bulkhead,thread-pool-bulkhead,timelimiter). In the run,resilience4j.retry.metrics.enabled=falseremoved everyresilience4j_retry_*series and left the others. -
Add tags to every instance of a module:
resilience4j.<module>.tags.<key>: <value>.resilience4j.circuitbreaker.tags.team=checkoutproducedresilience4j_circuitbreaker_state{application="bookshelf",name="pricing",state="closed",team="checkout"}. Theapplicationlabel in that line comes frommanagement.metrics.tags.application. -
Turn on histograms or service-level objectives: these are standard Micrometer distribution settings addressed by the Micrometer meter name.
management.metrics.distribution.percentiles-histogram.resilience4j.circuitbreaker.calls=trueaddedresilience4j_circuitbreaker_calls_seconds_bucket{…,le="0.001"}series in the run, andmanagement.metrics.distribution.slo.resilience4j.circuitbreaker.calls=100ms,500msadds fixed buckets. Histograms multiply the series count by the number of buckets, so enable them for the call timers you will actually query. -
Rename a meter: declare your own publisher bean with a names object; the auto-configured one is
@ConditionalOnMissingBeanand backs off.
@Configuration
class BreakerMetricNames {

    @Bean
    TaggedCircuitBreakerMetricsPublisher breakerMetrics(MeterRegistry registry) {
        return new TaggedCircuitBreakerMetricsPublisher(
            CircuitBreakerMetricNames.custom().stateMetricName("bookshelf.breaker.state").build(),
            registry);
    }
}
Source: the
CircuitBreakerMetricNames at v2.4.0.
In the run the series was exposed as bookshelf_breaker_state{name="pricing",state="closed"}, the default
resilience4j_circuitbreaker_state was gone, and resilience4j_circuitbreaker_calls_seconds_count was untouched, because only
the state name had been overridden. Renaming breaks every dashboard and alert that uses the default name, including the
official Grafana dashboard, so do it only when a naming convention forces it.
-
Legacy binders:
resilience4j.<module>.metrics.legacy.enabled=trueregisters the olderTagged…MetricsMeterBinderinstead of the publisher. The publisher is the default and the right choice.
The meters are updated by the instance itself, not by the annotation: a breaker used from Decorators, from a Reactor
operator or from a Feign interceptor is measured exactly like an annotated one, as long as the instance comes from the
registry. An instance built with CircuitBreaker.ofDefaults("x") outside the registry has no meters at all.
Grafana
Resilience4j ships a dashboard in its repository: grafana_dashboard.json at the repository root
(the file at the v2.4.0 tag, and the same
file on master). It was exported from Grafana 12.0.0 (schemaVersion 41) and needs a Prometheus data source. Import it
through Dashboards, New, Import and choose the data source when asked.
What is in it, read from the file at v2.4.0:
| Area | Panels and queries |
|---|---|
Summary |
Counts of closed, open ( |
CircuitBreaker |
Failure rate ( |
Retry |
The rate of |
Bulkhead |
|
Source: Resilience4j: Grafana and the dashboard file. Four things to know before relying on it:
-
It filters on labels that the application must provide. The
Applicationvariable islabel_values(jvm_info, application), so the service needs the common tagmanagement.metrics.tags.application, which the configuration above sets, and theInstancevariable uses theinstancelabel that Prometheus adds. Without theapplicationtag the retry and bulkhead panels are empty. -
Its buffered-calls panel also queries
resilience4j_circuitbreaker_max_buffered_calls. That meter does not exist in 2.4.0 (it is in the readme.io Micrometer table, which describes 2.2.0, but not in the source); the panel shows the buffered calls and an empty second series. -
It has no panels for rate limiters, time limiters, thread-pool bulkheads,
@Timermeters, or the not-permitted counter. Everything those modules expose is a meter in the tables above, so add panels from them. The thread-pool saturation view isresilience4j_bulkhead_queue_depthagainstresilience4j_bulkhead_queue_capacity, and the not-permitted rate israte(resilience4j_circuitbreaker_not_permitted_calls_total[5m]). -
The readme.io Grafana page was last updated years before Resilience4j 2.x and shows screenshots of the old layout. The file in the repository is the reference.
Logging the event streams
Every instance has an EventPublisher: circuitBreaker.getEventPublisher(), and the same on Retry, RateLimiter, Bulkhead,
ThreadPoolBulkhead and TimeLimiter. It offers one registration method per event type (onSuccess, onError,
onStateTransition, onCallNotPermitted, onRetry, onFailedAcquire, onCallRejected and so on) and a catch-all
onEvent. The listener runs synchronously on the thread that produced the event, so it must be fast and must not throw.
CircuitBreaker pricing = registry.circuitBreaker("pricing");
pricing.getEventPublisher().onEvent(event -> log.info("{}", event));
Source: Resilience4j: CircuitBreaker (consume emitted events). The
toString() of the events, from a run that used onEvent on a breaker, a retry, a rate limiter and a bulkhead:
CircuitBreaker 'pricing' recorded a successful call. Elapsed time: 0 ms
CircuitBreaker 'pricing' recorded an error: 'java.lang.IllegalStateException: 503'. Elapsed time: 0 ms
CircuitBreaker 'pricing' exceeded failure rate threshold. Current failure rate: 50.0
CircuitBreaker 'pricing' changed state from CLOSED to OPEN
CircuitBreaker 'pricing' recorded a call which was not permitted.
Retry 'isbn', waiting PT0.001S until attempt '1'. Last attempt failed with exception 'java.lang.IllegalStateException: 503'.
Retry 'isbn' recorded a failed retry attempt. Number of retry attempts: '2'. Giving up. Last exception was: 'java.lang.IllegalStateException: 503'.
RateLimiterEvent{type=SUCCESSFUL_ACQUIRE, rateLimiterName='isbn', creationTime=2026-10-04T19:06:30.945781+02:00[Europe/Madrid]}
RateLimiterEvent{type=FAILED_ACQUIRE, rateLimiterName='isbn', creationTime=2026-10-04T19:06:30.949059+02:00[Europe/Madrid]}
Bulkhead 'isbn' permitted a call.
Bulkhead 'isbn' rejected a call.
Bulkhead 'isbn' has finished a call.
Source: the output of the sample run (every line of the breaker, retry and bulkhead is preceded in the original by an ISO timestamp, which is omitted here). Logging every event of a busy service is itself an outage risk: a breaker that records every success writes a line per call. In a Spring Boot application the useful rules are to log state transitions and rejections, which are rare, and to count the rest with meters.
Registering listeners for every instance
A listener on an instance has to be attached before the first event, and breakers created by name at runtime would be missed
by a loop over getAllCircuitBreakers() at start-up. The registry’s own event consumer solves both: a RegistryEventConsumer
bean is called each time an instance is added, and the Boot auto-configuration collects every such bean.
package com.example.bookshelf.config;

import io.github.resilience4j.circuitbreaker.CircuitBreaker;
import io.github.resilience4j.core.registry.EntryAddedEvent;
import io.github.resilience4j.core.registry.EntryRemovedEvent;
import io.github.resilience4j.core.registry.EntryReplacedEvent;
import io.github.resilience4j.core.registry.RegistryEventConsumer;
import org.slf4j.Logger;
import org.slf4j.LoggerFactory;
import org.springframework.context.annotation.Bean;
import org.springframework.context.annotation.Configuration;

@Configuration
class ResilienceEventLogging {

    private static final Logger LOG = LoggerFactory.getLogger("bookshelf.resilience.events");

    @Bean
    RegistryEventConsumer<CircuitBreaker> circuitBreakerLogging() {
        return new RegistryEventConsumer<>() {
            @Override
            public void onEntryAddedEvent(EntryAddedEvent<CircuitBreaker> added) {
                added.getAddedEntry().getEventPublisher()
                    .onStateTransition(e -> LOG.warn("circuit breaker '{}' {}",
                        e.getCircuitBreakerName(), e.getStateTransition()))
                    .onCallNotPermitted(e -> LOG.warn("circuit breaker '{}' rejected a call",
                        e.getCircuitBreakerName()));
            }

            @Override
            public void onEntryRemovedEvent(EntryRemovedEvent<CircuitBreaker> removed) { }

            @Override
            public void onEntryReplacedEvent(EntryReplacedEvent<CircuitBreaker> replaced) { }
        };
    }
}
Source: Resilience4j: Spring Boot 2 & 3 (event consumer registry) and the
RegistryEventConsumer at v2.4.0.
The run, with a forced sequence of transitions, logged these lines (message part only):
circuit breaker 'pricing' State transition from CLOSED to OPEN
circuit breaker 'pricing' rejected a call            (six times)
circuit breaker 'pricingStrict' State transition from CLOSED to OPEN
circuit breaker 'pricing' State transition from OPEN to HALF_OPEN
circuit breaker 'pricing' State transition from HALF_OPEN to FORCED_OPEN
circuit breaker 'pricing' State transition from FORCED_OPEN to DISABLED
circuit breaker 'pricing' State transition from DISABLED to CLOSED
Source: the output of the sample run. Every transition made through the Actuator write operation is a
STATE_TRANSITION event, so this log is also the audit trail of who forced a breaker open and when (pair it with the
authenticated user of the request in your access log, because the event itself carries no user). The same pattern works for
Retry, RateLimiter, Bulkhead and TimeLimiter with the matching RegistryEventConsumer<…> type.
Alerting rules
Alerts should fire on symptoms the team can act on, and every rule below uses a meter from the tables above. The rules were
checked by extracting every resilience4j_* name from the expressions and looking each one up in the real scrape of the
sample run; all of them are present, and every label value used in a selector (state="open", kind="failed_with_retry",
kind="timeout") appears in that scrape. The expressions were not evaluated by a Prometheus server, because none was
available; run promtool check rules on the file before loading it.
groups:
  - name: bookshelf-resilience
    rules:
      - alert: BookshelfCircuitBreakerOpen
        expr: max by (application, instance, name) (resilience4j_circuitbreaker_state{state=~"open|forced_open"}) == 1
        for: 2m
        labels:
          severity: page
        annotations:
          summary: "Circuit breaker {{ $labels.name }} on {{ $labels.instance }} has been open for 2 minutes"

      - alert: BookshelfCircuitBreakerRejectingCalls
        expr: sum by (application, name) (rate(resilience4j_circuitbreaker_not_permitted_calls_total[5m])) > 0
        for: 5m
        labels:
          severity: ticket
        annotations:
          summary: "Breaker {{ $labels.name }} is rejecting {{ $value | humanize }} calls per second"

      - alert: BookshelfHighRetryRate
        expr: |
          sum by (application, name) (rate(resilience4j_retry_calls_total{kind=~"successful_with_retry|failed_with_retry"}[5m]))
            /
          sum by (application, name) (rate(resilience4j_retry_calls_total[5m]))
            > 0.2
        for: 10m
        labels:
          severity: ticket
        annotations:
          summary: "More than 20% of calls through retry {{ $labels.name }} needed a retry"

      - alert: BookshelfRetriesExhausted
        expr: sum by (application, name) (rate(resilience4j_retry_calls_total{kind="failed_with_retry"}[5m])) > 0
        for: 5m
        labels:
          severity: page
        annotations:
          summary: "Retry {{ $labels.name }} keeps giving up after its last attempt"

      - alert: BookshelfBulkheadSaturated
        expr: |
          resilience4j_bulkhead_available_concurrent_calls
            /
          resilience4j_bulkhead_max_allowed_concurrent_calls
            < 0.1
        for: 5m
        labels:
          severity: ticket
        annotations:
          summary: "Bulkhead {{ $labels.name }} has had less than 10% of its permits free for 5 minutes"

      - alert: BookshelfThreadPoolQueueFilling
        expr: |
          resilience4j_bulkhead_queue_capacity > 0
            and
          resilience4j_bulkhead_queue_depth / resilience4j_bulkhead_queue_capacity > 0.8
        for: 5m
        labels:
          severity: ticket
        annotations:
          summary: "Thread-pool bulkhead {{ $labels.name }} queue is more than 80% full"

      - alert: BookshelfTimeLimiterTimeouts
        expr: sum by (application, name) (rate(resilience4j_timelimiter_calls_total{kind="timeout"}[5m])) > 0.1
        for: 5m
        labels:
          severity: ticket
        annotations:
          summary: "TimeLimiter {{ $labels.name }} is cutting off calls"
Source: Prometheus: Alerting rules for the rule format, and the meters of the sample run. How to read them:
-
Open breaker. The state gauge is
1.0for exactly onestatelabel per breaker, so selectingopenandforced_openand comparing with1finds breakers in either condition. Thefor: 2mkeeps a breaker that opens and recovers in onewaitDurationInOpenStatecycle from paging anybody. A breaker you forced open on purpose will page too, which is usually what you want. -
Retry rate. The counter counts calls, so the ratio is "the share of calls that needed at least one retry". A steady 5 percent can be normal; a jump to 20 percent means the dependency is flaky even if users still get answers, which is exactly when retries hide an outage.
failed_with_retryis the share that did not recover, which is the actionable one. Remember that retries multiply load, so a rising retry rate is also a rising load on the dependency. -
Bulkhead saturation. The semaphore ratio uses the two gauges; a
maxWaitDurationof zero makes a full bulkhead reject at once, so the ratio near0for minutes means users are being rejected. For the thread pool the signal is the queue filling up, and the extraqueue_capacity > 0selector keeps a pool configured withqueueCapacity: 0(aSynchronousQueue, always empty by design) from dividing zero by zero. Neither bulkhead kind has a rejection counter, so count the rejections from the fallback or fromCALL_REJECTEDevents when you need a rate. -
Everything uses
by (application, name). Remove theapplicationlabel from the aggregations if the service does not set the common tag.
Prometheus has to be allowed to scrape the secured endpoint. The scrape job below reads the password of the monitoring user from a file mounted from a secret, which keeps it out of the configuration.
scrape_configs:
  - job_name: bookshelf-service
    metrics_path: /actuator/prometheus
    scrape_interval: 15s
    basic_auth:
      username: grafana
      password_file: /etc/prometheus/secrets/actuator-password
    static_configs:
      - targets: ["localhost:8081"]
Source: Prometheus: Configuration (basic_auth and
password_file). In Kubernetes use a ServiceMonitor or Pod annotations in place of static_configs; the scrape path and
the credentials are the same.
Tracing context through bulkhead threads
A call that goes through a ThreadPoolBulkhead runs on a pool thread, and every ThreadLocal of the caller is invisible
there: the logging MDC, the Spring Security context, the current Micrometer observation and, with it, the trace and span. A
trace that stops at the bulkhead, or log lines on the pool thread without a traceId, are the symptoms. The semaphore
bulkhead, the circuit breaker, the retry and the rate limiter run on the caller’s thread and have no such problem. The
mechanism and the MDC and security-context propagators are described in
Bulkhead; this section is about the Micrometer side.
The bridge is one ContextPropagator that takes a ContextSnapshot from Micrometer’s context-propagation library on the
caller thread and restores it on the pool thread. It is the propagator from the Bulkhead page, shown again here because the
tracing behaviour needs it.
public class SnapshotContextPropagator implements ContextPropagator<ContextSnapshot> {

    private static final ContextSnapshotFactory FACTORY = ContextSnapshotFactory.builder().build();
    private static final ThreadLocal<ContextSnapshot.Scope> SCOPE = new ThreadLocal<>();

    @Override
    public Supplier<Optional<ContextSnapshot>> retrieve() {
        return () -> Optional.of(FACTORY.captureAll());
    }

    @Override
    public Consumer<Optional<ContextSnapshot>> copy() {
        return snapshot -> snapshot.ifPresent(s -> SCOPE.set(s.setThreadLocals()));
    }

    @Override
    public Consumer<Optional<ContextSnapshot>> clear() {
        return snapshot -> {
            ContextSnapshot.Scope scope = SCOPE.get();
            if (scope != null) {
                scope.close();
                SCOPE.remove();
            }
        };
    }
}
resilience4j:
thread-pool-bulkhead:
instances:
recommendations:
coreThreadPoolSize: 2
maxThreadPoolSize: 4
queueCapacity: 10
contextPropagators:
- com.example.bookshelf.SnapshotContextPropagatorSource: Micrometer Context Propagation,
Micrometer Observation and
Spring Boot: Tracing. The class must be on the classpath
with a no-argument constructor (contextPropagators takes class names), and io.micrometer:context-propagation must be a
dependency. The run used Spring Boot’s Brave tracing bridge (micrometer-tracing-bridge-brave and
spring-boot-micrometer-tracing-brave) with management.tracing.sampling.probability=1.0, and a recommendations method
annotated @Bulkhead(name = "recommendations", type = Bulkhead.Type.THREADPOOL) that records what it sees on its pool thread.
The results were not what a quick read of the documentation suggests:
| What the caller had open | Propagator | What the pool thread saw | Verdict |
|---|---|---|---|
A span from |
|
|
Nothing carried over. |
The same, after |
|
|
The log context arrived; the span did not. |
An |
|
The same |
The whole context arrived. |
Source: the output of the sample run (three calls through the same bulkhead, with the pool thread names
bulkhead-recommendations-1 and -2). What follows from it:
-
The snapshot carries the
ThreadLocals that are registered in theContextRegistry. The Observation accessor is registered bymicrometer-observationitself, so an observation, and the span that the tracing handler binds to it, crosses the thread boundary with this one propagator. A bare tracer span that is not part of an observation does not. -
The MDC is not registered by default.
Slf4jThreadLocalAccessorexists inio.micrometer.context.integration, but it has to be registered, once, for the keys you want (the accessor takes the key names). Spring Boot’s tracing support putstraceIdandspanIdin the MDC of the thread where the span is current, which is why the MDCtraceIdarrived in the second row once the accessor was registered. -
Code that creates its own spans with the bare
TracerAPI loses them at the pool. Wrap the work in an observation (Observation.createNotStarted(…)andstart()) so that the span is bound to something the snapshot carries. -
The propagator runs for
ThreadPoolBulkheadonly. A semaphore bulkhead, a retry or a breaker needs none.
A worked example: Bookshelf in an outage
The pieces above come together in one scenario: the pricing-service starts answering 503, and the on-call engineer sees it.
The configuration is the monitoring YAML and the health block earlier on this page, the security configuration, the logging
consumer and the alert rules. The pricing call is the one from the first page of the section:
package com.example.bookshelf.pricing;

@Component
public class PricingClient {

    private final RestClient http;

    public PricingClient(RestClient.Builder builder,
                         @Value("${bookshelf.pricing.url}") String baseUrl) {
        this.http = builder.baseUrl(baseUrl).build();
    }

    @CircuitBreaker(name = "pricing", fallbackMethod = "lastKnownPrice")
    public Money price(String isbn) {
        return http.get().uri("/prices/{isbn}", isbn).retrieve().body(Money.class);
    }

    Money lastKnownPrice(String isbn, Throwable t) {
        return new Money(isbn, 0, true);       // stale marker, no exception for the caller
    }
}
Source: Resilience4j: Spring Boot 2 & 3 (annotations with a fallback). The
sample run replayed an outage against a version of this class whose body threw when a switch was set. The breaker has a
four-call window (slidingWindowSize: 4, minimumNumberOfCalls: 4, threshold 50 percent). After three good calls the switch
was set and eight more calls were made. Each signal shows it in its own way:
| Signal | What it showed |
|---|---|
Callers |
Eight stale-price responses from the fallback, and no exception. A user sees a price marked stale and no error page. |
|
|
|
Three |
Log |
|
|
|
|
|
Alerts |
|
Runbook |
|
Source: the output of the sample run. The curl command lines are the ones shown in the sections above. Two more rows of
the same scenario matter for tuning. The pricing breaker has no slow-call settings, so a pricing-service that gets slow but
never fails would not open it; the slowCallRate field of the endpoint and resilience4j_circuitbreaker_slow_call_rate would
show the symptom, and the breaker page explains the settings. And the isbn retry sits outside the breaker by default (the
aspect order of
Annotations and Aspect Order), so when both annotate the
same method the breaker’s calls timer and failedCalls count every attempt, while resilience4j_retry_calls_total counts
each logical call once. Read the two together before you decide that "the breaker saw three failures".
Common pitfalls
| Pitfall | What to do instead |
|---|---|
Exposing |
Expose the endpoints by name, on |
Posting a state change with a typo in the name |
The endpoint creates a new default breaker. Check the name against |
Enabling |
The application fails to start for lack of a |
Setting |
The indicator bean is |
Adding |
A dependency outage restarts every replica. Keep the indicators in a custom group, and out of liveness. |
Using |
It turns a degraded service |
Expecting |
It is a custom status that the default |
Reading the endpoint failure rate as a percentage of all calls |
It is the rate over the current window, |
Alerting on a missing counter for bulkhead rejections |
There is none. Bulkheads expose gauges and |
Querying |
The gauge is one series per state with |
Importing the Grafana dashboard without the |
The variables and the retry and bulkhead panels are empty. Set |
High-cardinality tags |
The |
Pool threads without a propagator |
A trace that ends at the bulkhead and log lines without |
Logging every success event |
One log line per call. Log transitions and rejections, and count the rest with meters. |
What changed recently
-
Resilience4j 2.4.0. The Spring Boot 4 starter (
resilience4j-spring-boot4) moved the autoconfiguration to the Boot 4 health and Actuator packages. The meter names, the tags, the endpoint ids and the endpoint JSON described on this page are the same as on 2.3.0 and Boot 3. Two details to know when reading the older docs: the readme.io Micrometer page (written for 2.2.0) still listsresilience4j.circuitbreaker.max.buffered.calls, which the 2.4.0 source does not register, shows the retry meter as a gauge with dottedkindvalues such assuccessful.without.retrywhere the source has aFunctionCounternamedresilience4j_retry_calls_totalwith underscored kinds, and its Grafana page is unchanged for years. -
Spring Boot 4.
HealthIndicatorandHealthmoved toorg.springframework.boot.health.contributorandStatusAggregatortoorg.springframework.boot.health.actuate.endpoint(Boot 3:org.springframework.boot.actuate.health). The Actuator security matcherEndpointRequestis inorg.springframework.boot.security.autoconfigure.actuate.web.servlet(Boot 3:org.springframework.boot.actuate.autoconfigure.security.servlet). Applications that only use properties are unaffected. In the sample run the liveness and readiness groups were present without configuration on Boot 4.1.1, while on Boot 3.5.16 outside Kubernetes alivenessgroup that includedlivenessStatefailed at start-up untilmanagement.endpoint.health.probes.enabled=truewas set. -
Spring Boot 3.4 and later.
management.endpoint.<id>.access(none,read-only,unrestricted) replacesmanagement.endpoint.<id>.enabled; use it to remove the circuit breaker write operation. -
Spring Boot tests. On Spring Boot 3.5.16 a
@SpringBootTestdoes not export metrics unless the test class is annotated with@AutoConfigureObservability; without it the/actuator/prometheusresponse in the test had noresilience4j_series. The Boot 4.1.1 sample tests produced the series without the annotation. -
Micrometer 1.17 and the Prometheus client 1.x. Timers are exposed as summaries with
_seconds_count,_seconds_sumand a separate_seconds_maxgauge, and counters carry_total, as shown in the scrape above; dashboards built for the old_countand_sumnames of Resilience4j 1.x on Micrometer 1.5 need those names updated. -
Migration. The full Resilience4j and Spring Boot version changes are collected in Migration & What’s Changed.