PromQL: Operators & Aggregation
|
This section documents the current Prometheus 3.x line (latest 3.14.0) as published at the Prometheus documentation and the current Grafana 13.x line (latest 13.2.1) as published at the Grafana documentation, which are the references these pages are written and verified against. No specific patch version is pinned. Some capabilities (Grafana Enterprise-only features, Grafana Cloud-hosted services, and long-term-storage systems like Thanos/Cortex/Mimir) are linked, not documented in depth. This content was generated with the assistance of AI and should be verified against the official documentation before being relied on in production, since both projects iterate quickly. This section’s bibliography lists the reference material consulted while preparing these pages. |
PromQL: Basics & Selectors covered selecting individual time series. This page covers what PromQL does once two vectors need to be combined or one vector needs to be collapsed: arithmetic, comparison and logical/set binary operators; vector matching, the label-based rule that decides which series on the left pair with which series on the right; and the aggregation operators that reduce many series down to fewer, grouped by label. See Operators for the authoritative reference this page works from.
Arithmetic operators
+ - * / % ^ work between two scalars, between a scalar and a vector (applied to every sample), or
between two instant vectors (matched series-by-series — see Vector matching below):
# scalar <op> vector: convert a byte gauge to megabytes
node_memory_used_bytes / 1024 / 1024

# vector <op> vector: fraction of memory used per instance
node_memory_used_bytes / node_memory_total_bytes
% is floating-point remainder and ^ is exponentiation (right-associative, so 2 ^ 3 ^ 2 is 2 ^
(3 ^ 2)). Every arithmetic operator between two vectors requires them to be matched first — an
unqualified / above only works because both sides share exactly the same label set apart from the
metric name; as soon as the label sets diverge, on/ignoring become necessary.
Comparison operators
== != > < >= ⇐ compare a vector against a scalar or against another vector, and by default they
filter: the result keeps only the samples for which the comparison is true, with their original
value.
# filtering form: only series currently reporting down
up == 0

# only instances above 80% CPU
100 * (1 - avg by (instance) (rate(node_cpu_seconds_total{mode="idle"}[5m]))) > 80
Appending the bool modifier switches a comparison from a filter to a projection: every input
series is kept, with its value replaced by 1 (true) or 0 (false) instead of being dropped:
# one series per target, value 1 if up, 0 if down -- good for sum()/Grafana stat panels
up == bool 1

# count how many targets in a job are currently down
sum(up{job="orders-api"} == bool 0)
bool is mandatory when comparing two vectors without filtering intent, and is what makes a
comparison usable as an arithmetic input rather than a row filter.
Logical and set operators
and, or and unless work only between two instant vectors, and operate on the label sets of
matching series rather than on values — they never touch a series' numeric value, only whether it
is kept:
# and: keep left-hand series that have a matching series on the right (by label set, ignoring value)
node_filesystem_avail_bytes / node_filesystem_size_bytes < 0.1
  and node_filesystem_readonly == 0
  # low disk space, but only where the filesystem isn't already read-only

# or: union -- left-hand series, plus any right-hand series with no match on the left
rate(http_requests_total{status=~"5.."}[5m]) > 0
  or on(instance) up == 0
  # error-rate series, plus targets that are simply down (no error series to compare)

# unless: left-hand series with NO matching series on the right
ALERTS{alertstate="firing"} unless on(alertname, instance) ALERTS{alertstate="pending"}
  # firing alerts that are not also currently pending elsewhere
Binary operator precedence, highest to lowest, is ^, then * / %, then + -, then the comparison
operators, then and unless, then or — parenthesize rather than rely on memorizing this when a
query mixes categories, as the examples above do.
Vector matching
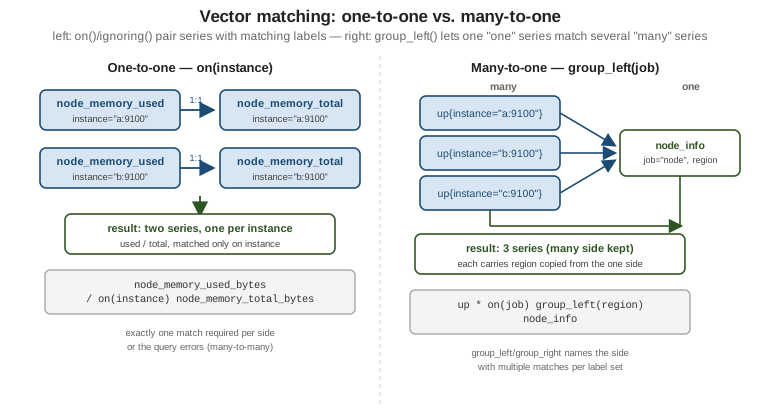
Every operator between two instant vectors needs a rule for which sample on the left pairs with
which sample on the right, because each side can carry a different label set. PromQL calls this
vector matching, and it is one-to-one by default: it strips the metric name from both sides, then
matches series whose remaining label sets are identical. on(<labels>) narrows that match to only
the named labels; ignoring(<labels>) does the opposite, matching on every label except the named
ones. Exactly one of the two may be used per operator.
# on(): match only on instance, ignore every other differing label
node_memory_used_bytes / on(instance) node_memory_total_bytes

# ignoring(): match on everything except job (the two metrics come from different jobs)
rate(app_requests_total[5m]) / ignoring(job) rate(app_requests_total_baseline[5m])
If, after applying on/ignoring, more than one series on either side shares the same matched
label set, the query is a many-to-many match and PromQL refuses it with a "multiple matches for
labels" error — vector matching only ever resolves one-to-one or explicit many-to-one.
Many-to-one and one-to-many: group_left / group_right
A many-to-one match is allowed, but only when made explicit: the side with multiple matches per
matched label set is named with group_left(<labels>) or group_right(<labels>), and any extra
labels listed there are copied from the single-match ("one") side onto every result on the
many-match side. group_left means "the left side is many"; group_right means "the right side is
many."
A common use is joining a metric that has one series per label combination (like up) against an
info metric — a metric whose value is meaningless (usually 1) and which exists only to attach
extra labels via its label set, often built with label_replace():
# build an info-style metric: one series per job, carrying a region label
label_replace(
  up{job="node"},
  "region", "eu-west-1", "job", "node"
)

# a real info metric already scraped this way, one series per job
node_info{job="node", region="eu-west-1"}

# many-to-one: every up{job="node", instance=...} series (many) is joined to the
# single node_info{job="node"} series (one), gaining its "region" label
up{job="node"} * on(job) group_left(region) node_info{job="node"}
here is just a convenient carrier — up is already 0 or 1, so multiplying by the info
series' value (1) leaves it unchanged while group_left(region) does the actual work of attaching
region to each of the many up series. The same pattern ( on(…) group_left(…)) is the
standard way to enrich kube_pod_info, kube_node_labels, and similar Kubernetes metadata metrics
onto per-container or per-node series in
Containers & Kubernetes
Monitoring. Without group_left/group_right, PromQL cannot tell that a many-to-one join was
intended and raises the many-to-many error instead.
Aggregation operators
Aggregation operators take one instant vector and reduce it, grouped by label, to fewer output series — collapsing per-instance or per-pod series down to a per-job or fleet-wide view.
| Operator | Reduces to |
|---|---|
|
sum of the values in each group |
|
average of the values in each group |
|
smallest / largest value in each group |
|
number of series in each group (not their values) |
|
number of series sharing each distinct value, emitted as a new label |
|
the k series with the highest / lowest value in each group, values kept |
|
the phi-quantile (0 to 1) of the values in each group, interpolated |
|
standard deviation / variance of the values in each group |
# total request rate across every instance of a job
sum(rate(http_requests_total{job="orders-api"}[5m]))

# average CPU utilization per job, across all instances
avg by (job) (100 * (1 - rate(node_cpu_seconds_total{mode="idle"}[5m])))

# the 5 instances with the highest memory usage right now
topk(5, node_memory_used_bytes)

# how many targets report each up value (0 or 1), per job
count_values("up_value", up) by (job)

# p50 (median) request rate across instances, per job
quantile by (job) (0.5, rate(http_requests_total[5m]))
quantile() aggregates across series — it does not compute a percentile from within one
histogram’s buckets. For a latency percentile like p99 from a native or classic histogram, use
histogram_quantile() instead; see
PromQL: Functions.
by and without
Every aggregation operator can take a by (<labels>) or without (<labels>) clause to control
grouping. by keeps only the named labels on the output (grouping series that share those
values); without does the reverse, dropping the named labels and keeping every other label,
grouping series that agree on everything else:
# by: output has exactly one series per job, with only the job label kept
sum by (job) (rate(http_requests_total[5m]))

# without: drop instance (and the metric name); keep every other label (job, method, status, ...)
sum without (instance) (rate(http_requests_total[5m]))
Omitting both clauses aggregates everything into a single output series with no labels at all — almost never what’s wanted once more than one job or environment is being scraped, so most real
queries name a by/without clause explicitly. topk/bottomk behave slightly differently from
the rest of the table: they keep the original labels on every returned series (not just the
grouping labels), since the point is to identify which specific series are largest or smallest, not
to collapse them.
Continue with PromQL: Functions for rate(),
histogram_quantile(), label_replace() and the rest of PromQL’s function library, or see
Recording & Alerting Rules for turning
queries like these into named, precomputed series and alerts.