Observability
|
This content was generated with the assistance of AI and should be verified against the official documentation before being relied on in production. The reference material consulted while preparing these pages is listed in the section bibliography. |
A scheduler that runs unattended is only as good as your ability to tell, at three in the morning, whether the nightly job ran, how long it took, why it failed and whether the other nodes noticed. Quartz offers pieces of an answer in several places (an Actuator endpoint, listener callbacks, a JMX bean, log plugins and a set of database tables) and Spring Boot adds exactly one of them, the endpoint. There is no Quartz health indicator and no Quartz metric in Spring Boot. This page shows what each source tells you, builds the missing metrics, health indicator, log context and trace spans on the listeners of the previous page, and ends with alert rules and a table of the traps.
It was written against Quartz 2.5.2, Spring Boot 4.1.1, Spring Framework 7.0.9 and Java 21 and verified on 5 October 2026: every behaviour below was run in a test project (Micrometer 1.17.1, Prometheus 3.x for the queries and rules) and the outputs are quoted, not assumed. Spring Boot 3.5.16 manages the same Quartz 2.5.2 and behaves the same way; the Spring packages differ, and the What changed section lists them. The page continues the running Bookshelf scenario: the cache refresh, the nightly overdue-loan reminders, the weekly statistics report, the monthly retention cleanup and the per-member reminders.
Where each signal comes from
Before building anything it helps to know which source answers which question, and for which part of the system. The first diagram shows the sources; the metrics pipeline further down shows what is done with the numbers. Boxes in green are provided by Spring Boot or Quartz itself, boxes in orange are the code written on this page.
| Question | Source | Provided? | Scope |
|---|---|---|---|
Which jobs and triggers exist, when did they last fire and when do they fire next, which state is a trigger in |
The Actuator |
Boot, but not exposed by default |
The whole scheduler. With a JDBC store every node answers for the whole cluster |
Run this job now |
|
Boot, same exposure rule |
Fires on whichever node takes the trigger |
How long did each job take, how often does it fail |
|
No, built below |
The node that ran the job |
Did a trigger miss its time |
|
No, built below |
The node whose misfire scan found it |
Did Quartz itself hit an error (a store failure, a listener bug) |
|
No, built below |
The node that hit it |
How many jobs are running now |
|
No, built below |
This node only, even with a JDBC store |
Is the scheduler started, in standby, shut down |
|
No health indicator, built below |
This node |
Is this node still checking in to the cluster |
The |
No, built below or queried |
The cluster |
Which job wrote this log line |
An MDC entry set by a listener |
No, built below |
The worker thread |
Which trace does this execution belong to |
A Micrometer |
No, built below |
The worker thread |
The same questions for |
|
Boot, automatic |
This node |
Two scope rules recur through the page and are worth stating once. Everything that comes from a listener or from SchedulerMetaData describes the node it ran on, so a metric must be aggregated over the instances at query time, and getCurrentlyExecutingJobs (like Scheduler.interrupt) never sees a job running on another node. Everything that is stored in the job store (triggers, fire times, check-ins) is visible to every node, which is why the endpoint and the SQL queries are the right tools for questions about the cluster.
The Actuator quartz endpoint
Spring Boot registers a QuartzEndpoint with the id quartz when an Actuator and a Scheduler bean are both present. In Boot 4.1.1 it lives in org.springframework.boot.quartz.actuate.endpoint, its auto-configuration in org.springframework.boot.quartz.autoconfigure, and the properties in the management.endpoint.quartz namespace.
Exposing it and limiting what it may do
Actuator endpoints are guarded twice: an endpoint must be exposed over the web, and it must be accessible. Quartz is not exposed by default. On a fresh application GET /actuator lists only health and GET /actuator/quartz answers 404 (measured). The test project exposes what this page uses:
management:
  endpoints:
    web:
      exposure:
        include: health,prometheus,quartz,scheduledtasks
  endpoint:
    quartz:
      access: read-only        # none, read-only or unrestricted
      show-values: when-authorized
      roles: OPS
    health:
      show-details: when-authorized
  server:
    port: 8081                 # serve the actuator on a port that only the cluster network reaches
Source: Spring Boot: Endpoints
management.endpoint.quartz.access takes the three values of the org.springframework.boot.actuate.endpoint.Access enum, and the table lists what each did to the same application (the GET and POST are the requests of the next two sections):
| Value | GET /actuator/quartz |
POST trigger now |
Link in /actuator |
|---|---|---|---|
|
200 |
200 |
All five quartz links |
|
200 |
405 Method Not Allowed |
Four links: the |
|
404 |
404 |
No quartz link: the endpoint does not exist |
Two more switches act on every endpoint. management.endpoints.access.default sets the access of all endpoints that have no management.endpoint.<id>.access of their own, and management.endpoints.access.max-permitted caps every endpoint, whatever its own setting says (both are read by PropertiesEndpointAccessResolver in the 4.1.1 source; the combination default: none plus quartz.access: read-only ran as expected). The older management.endpoint.quartz.enabled=false is deprecated since Spring Boot 3.4 but is still honoured in 4.1.1 (it produced the same 404 as access: none); setting both keys for one endpoint fails the start-up (measured: "The following configuration properties are mutually exclusive"), so migrate rather than mix. For production use read-only unless somebody really needs the trigger-now operation.
A last exposure decision is the port. With management.server.port set to a different port than the application’s, the application port answered 404 for /actuator/quartz and the management port answered 200 (measured), so a Kubernetes Service that exposes only the application port also keeps the endpoint away from the outside. See Metrics & Observability for the general Actuator set-up.
The read paths with real output
The web extension (QuartzEndpointWebExtension) maps the following read operations. The first segment after the endpoint is either jobs or triggers; any other word answers 400, an unknown group or name answers 404 with an empty body (measured).
| Path | Answers |
|---|---|
|
The job group names and the trigger group names |
|
Every job group with the names of its jobs |
|
Every trigger group with a |
|
The jobs of one group with their class names |
|
The triggers of one group, grouped by trigger type, each with fire times, priority and its schedule |
|
One job: class, durability, recovery flag, the (sanitized) |
|
One trigger: state, type, start, previous and next fire time, priority, the (sanitized) data map and the schedule details |
The responses below come from the Bookshelf scheduler of the verification project (four jobs in the group bookshelf; values were captured while the lab ran, so the timestamps belong to that run). First the two overviews:
{"jobs":{"groups":["bookshelf"]},"triggers":{"groups":["bookshelf"]}}

{"groups":{"bookshelf":{"jobs":["cacheRefresh","retentionCleanup","weeklyStatistics","overdueLoanReminders"]}}}
Source: Spring Boot Actuator API: Quartz
{"groups":{"bookshelf":{"paused":false,"triggers":["weeklyStatisticsTrigger","retentionCleanupTrigger","overdueLoanRemindersTrigger","cacheRefreshTrigger"]}}}Source: Spring Boot Actuator API: Quartz
The group paths:
{"group":"bookshelf","jobs":{"cacheRefresh":{"className":"bookshelf.CacheRefreshJob"},"retentionCleanup":{"className":"bookshelf.RetentionCleanupJob"},"weeklyStatistics":{"className":"bookshelf.WeeklyStatisticsJob"},"overdueLoanReminders":{"className":"bookshelf.OverdueLoanRemindersJob"}}}Source: Spring Boot Actuator API: Quartz
{
  "group": "bookshelf",
  "paused": false,
  "triggers": {
    "calendarInterval": {},
    "cron": {
      "weeklyStatisticsTrigger": {
        "nextFireTime": "2026-10-12T04:00:00.000Z", "priority": 5,
        "expression": "0 0 6 ? * MON", "timeZone": "Europe/Madrid" },
      "retentionCleanupTrigger": {
        "nextFireTime": "2026-11-01T02:30:00.000Z", "priority": 5,
        "expression": "0 30 3 1 * ?", "timeZone": "Europe/Madrid" },
      "overdueLoanRemindersTrigger": {
        "previousFireTime": "2026-10-05T08:58:22.000Z", "nextFireTime": "2026-10-05T08:58:24.000Z",
        "priority": 5, "expression": "0/2 * * * * ?", "timeZone": "Europe/Madrid" }
    },
    "custom": {},
    "dailyTimeInterval": {},
    "simple": {
      "cacheRefreshTrigger": {
        "previousFireTime": "2026-10-05T08:58:22.720Z", "nextFireTime": "2026-10-05T08:58:23.720Z",
        "priority": 5, "interval": 1000 }
    }
  }
}
Source: Spring Boot Actuator API: Quartz
The reminders job runs every two seconds only in the lab so that tests finish quickly; its production schedule is 0 0 2 * * ?. The detail paths, with the job data masked as it is by default:
{"className":"bookshelf.OverdueLoanRemindersJob","data":{"runs":"******"},"durable":true,"group":"bookshelf","name":"overdueLoanReminders","requestRecovery":false,"triggers":[{"group":"bookshelf","name":"overdueLoanRemindersTrigger","previousFireTime":"2026-10-05T08:58:22.000Z","nextFireTime":"2026-10-05T08:58:24.000Z","priority":5}]}Source: Spring Boot Actuator API: Quartz
{"group":"bookshelf","name":"overdueLoanRemindersTrigger","state":"NORMAL","type":"cron","startTime":"2026-10-05T08:58:22.000Z","previousFireTime":"2026-10-05T08:58:22.000Z","nextFireTime":"2026-10-05T08:58:24.000Z","priority":5,"data":{},"cron":{"expression":"0/2 * * * * ?","timeZone":"Europe/Madrid"}}Source: Spring Boot Actuator API: Quartz
{"group":"bookshelf","name":"cacheRefreshTrigger","state":"NORMAL","type":"simple","startTime":"2026-10-05T08:58:22.720Z","previousFireTime":"2026-10-05T08:58:22.720Z","nextFireTime":"2026-10-05T08:58:23.720Z","priority":5,"data":{},"simple":{"interval":1000,"repeatCount":-1,"timesTriggered":1}}Source: Spring Boot Actuator API: Quartz
What the endpoint is good for in operations: state (NORMAL, PAUSED, BLOCKED, ERROR, COMPLETE) tells whether a trigger will fire at all, nextFireTime whether the schedule is what you think it is, and previousFireTime whether it fired when it should have. With a JDBC store previousFireTime is persisted, so unlike every in-process metric it survives a restart and is the better evidence that a weekly or monthly job ran. Two limits are worth knowing. A pauseAll marks the groups as paused in the paused flag of each group (measured on the RAM and the JDBC store), but on a JDBC store Scheduler.getPausedTriggerGroups() also returns a pseudo group named _$_ALL_GROUPS_PAUSED_$_, which is not a real group: code that loops over the paused groups and looks each one up will see it (measured: [bookshelf, _$_ALL_GROUPS_PAUSED_$_]). And the endpoint reads the scheduler group by group: a job deleted between listing its group and reading its details is a window for the same race that affects any code written with getJobKeys followed by getJobDetail, which returns null in that case; it was not provoked here.
Triggering a job now
The one write operation is a POST to /actuator/quartz/jobs/{group}/{name} with a JSON body whose state is running. The endpoint calls scheduler.triggerJob(jobKey), which stores an immediate one-shot trigger for the job, and returns the key and the time of the trigger. The operation exists in Spring Boot 3.5 and 4.x and not before: the QuartzEndpointWebExtension class of Spring Boot 3.4.4 and 3.4.7 has no triggerQuartzJob method (checked with javap), while 3.5.5 and 3.5.16 have it, so the endpoint of the 3.4 line is read-only.
curl -s -X POST -H 'Content-Type: application/json' \
     -d '{"state":"running"}' \
     http://localhost:8081/actuator/quartz/jobs/bookshelf/retentionCleanup
Source: Spring Boot Actuator API: Quartz
{"className":"bookshelf.RetentionCleanupJob","group":"bookshelf","name":"retentionCleanup","triggerTime":"2026-10-05T08:58:23.030783Z"}Source: Spring Boot Actuator API: Quartz
| Request | Status | Meaning |
|---|---|---|
|
200 |
The job was triggered |
|
400 |
Only the state |
|
404 |
Nothing was triggered |
Access is |
405 |
The operation is not mapped |
The consequences follow from what triggerJob does. The job runs once through the normal path, so the listeners see it and the job gets its stored job data as for any other fire. The endpoint is a run now button and not a management API: pausing, resuming and deleting need your own endpoints, secured like the reminders API of Dynamic Scheduling & Management. Treat the POST as a privileged operation, because starting the retention cleanup at midday is a production change; the securing section below shows how to restrict it to one role.
Masked values: show-values, roles and SanitizingFunction
A JobDataMap often contains things that must not leave the application (an e-mail address, an API key somebody put there). The endpoint therefore masks every value of the job and trigger data maps with ****** unless the configuration says otherwise. The three layers are:
| Property or bean | Default | Effect |
|---|---|---|
|
|
|
|
empty |
With |
A |
none |
Applied only when values are shown: masks the values whose key matches. It is the last filter before the response |
The job of the examples carries two entries that stand for what people really store: a notification address and a key (the value is a dummy). The measured responses for the same job under the three settings:
// never
"data": { "notifyEmail": "******", "mailApiKey": "******", "runs": "******" }

// always
"data": { "notifyEmail": "library@example.org", "mailApiKey": "demo-not-a-secret", "runs": 3 }

// always, with the SanitizingFunction below
"data": { "notifyEmail": "library@example.org", "mailApiKey": "******", "runs": 4 }
Source: Spring Boot Actuator API: Quartz
The SanitizingFunction is an ordinary bean. The factory methods (sanitizeValue() and the ifKey… filters) exist since Spring Boot 3.5; the interface and SanitizableData are in org.springframework.boot.actuate.endpoint in both Boot lines.
import org.springframework.boot.actuate.endpoint.SanitizingFunction;
import org.springframework.context.annotation.Bean;
import org.springframework.context.annotation.Configuration;
import org.springframework.context.annotation.Profile;

@Configuration(proxyBeanMethods = false)
@Profile("sanitize")
public class SanitizeConfig {

    @Bean
    SanitizingFunction jobDataSecrets() {
        return SanitizingFunction.sanitizeValue().ifKeyContains("key", "token", "password", "secret");
    }
}Reading the source of Sanitizer in 4.1.1 explains two behaviours that surprise people. A SanitizingFunction is not consulted when values are masked: with show-values: never every value is ****** whatever the function does, so the function can only remove values from a response that would otherwise show them. And the bean is global: the same function also filters the env, configprops and other endpoints that use the sanitizer, so a key pattern that is right for job data may mask too much elsewhere. The better defence is not to put secrets in a JobDataMap at all, because with a JDBC store the map is also a BLOB in the database and in every backup; keep the key in configuration and let the job read it from a bean.
Securing the endpoint
The endpoint reveals the job names and classes, the schedules and (optionally) data, and its POST starts work. The rule of thumb is: not on the public port, not anonymous, read-only unless needed, and a separate role for the write. The test project secured it with Spring Security (see Spring Security): health is open for the probes, everything else on the actuator needs a role, the trigger-now operation needs OPS, and roles: OPS in the configuration above makes only OPS see unmasked values. The passwords come from the environment, never from the code.
import org.springframework.beans.factory.annotation.Value;
import org.springframework.boot.security.autoconfigure.actuate.web.servlet.EndpointRequest;
import org.springframework.context.annotation.Bean;
import org.springframework.context.annotation.Configuration;
import org.springframework.http.HttpMethod;
import org.springframework.security.config.Customizer;
import org.springframework.security.config.annotation.web.builders.HttpSecurity;
import org.springframework.security.config.annotation.web.configurers.AbstractHttpConfigurer;
import org.springframework.security.core.userdetails.User;
import org.springframework.security.core.userdetails.UserDetailsService;
import org.springframework.security.crypto.factory.PasswordEncoderFactories;
import org.springframework.security.crypto.password.PasswordEncoder;
import org.springframework.security.provisioning.InMemoryUserDetailsManager;
import org.springframework.security.web.SecurityFilterChain;

@Configuration(proxyBeanMethods = false)
public class ActuatorSecurityConfig {

    @Bean
    SecurityFilterChain actuatorChain(HttpSecurity http) throws Exception {
        http.securityMatcher(EndpointRequest.toAnyEndpoint())
            .authorizeHttpRequests(auth -> auth
                .requestMatchers(EndpointRequest.to("health")).permitAll()
                // only operators may run a job now; everybody with an actuator role may read
                .requestMatchers(HttpMethod.POST, "/actuator/quartz/**").hasRole("OPS")
                .anyRequest().hasAnyRole("VIEWER", "OPS"))
            .httpBasic(Customizer.withDefaults())
            .csrf(AbstractHttpConfigurer::disable);   // stateless basic-auth API, no browser session
        return http.build();
    }

    @Bean
    UserDetailsService users(@Value("${VIEWER_PASSWORD}") String viewerPassword, @Value("${OPS_PASSWORD}") String opsPassword) {
        PasswordEncoder encoder = PasswordEncoderFactories.createDelegatingPasswordEncoder();
        return new InMemoryUserDetailsManager(
                User.withUsername("viewer").password(encoder.encode(viewerPassword)).roles("VIEWER").build(),
                User.withUsername("ops").password(encoder.encode(opsPassword)).roles("OPS").build());
    }
}The measured result for four callers and three requests:
| Caller | Request | Status | Observed |
|---|---|---|---|
Anonymous |
|
200 |
Open, as configured |
Anonymous |
|
401 |
|
|
|
200 |
The group overview |
|
|
200 |
Data masked: |
|
|
200 |
Data shown: |
|
|
403 |
Not allowed to trigger |
|
|
200 |
Triggered |
CSRF protection is switched off for this chain because it serves a stateless, basic-authenticated API without browser sessions; keep it on if the same chain also serves browser pages. On Spring Boot 3.5 the class is org.springframework.boot.actuate.autoconfigure.security.servlet.EndpointRequest; the chain is otherwise identical.
The standard-scheduling counterpart: scheduledtasks and tasks.scheduled.execution
Plain @Scheduled methods have their own, smaller set of signals, and it is worth seeing them next to Quartz’s because they answer the same questions with less. The test project carries two @Scheduled methods next to the Quartz jobs: a fixed-delay re-index and a cron session expiry (@EnableScheduling is on the application class).
{
  "cron": [
    { "expression": "0 0 5 * * *",
      "nextExecution": { "time": "2026-10-06T02:59:59.999884Z" },
      "runnable": { "target": "bookshelf.StandardTasks.expireSessions" } }
  ],
  "custom": [],
  "fixedDelay": [
    { "initialDelay": 1000, "interval": 2000,
      "lastExecution": { "status": "SUCCESS", "time": "2026-10-05T11:28:30.144218Z" },
      "nextExecution": { "time": "2026-10-05T11:28:32.144992Z" },
      "runnable": { "target": "bookshelf.StandardTasks.reindexCatalogue" } }
  ],
  "fixedRate": []
}The response is grouped by the kind of task and carries, for the tasks that have run, the status and time of the last execution. The cron entry above is the 05:00 Europe/Madrid expression, reported one millisecond before 03:00 UTC, which is how Spring computes the next instant. The endpoint lists only what Spring’s ScheduledTaskHolder beans know about: the Quartz jobs are not in it (they are in the quartz endpoint), and, unlike the Quartz endpoint, it has no path to run a task and no per-task detail beyond what is shown.
For metrics, Spring Framework 6.1 introduced an observation named tasks.scheduled.execution, and Spring Boot’s observation auto-configuration enables it when an ObservationRegistry exists: it sets the registry on the ScheduledTaskRegistrar through a SchedulingConfigurer bean. A test run produced these series for the re-index method (Prometheus format, abbreviated):
tasks_scheduled_execution_seconds_count{code_function="reindexCatalogue",code_namespace="bookshelf.StandardTasks",error="none",exception="none",outcome="SUCCESS"} 15
tasks_scheduled_execution_seconds_sum{code_function="reindexCatalogue",code_namespace="bookshelf.StandardTasks",error="none",exception="none",outcome="SUCCESS"} 0.013595372
tasks_scheduled_execution_seconds_max{code_function="reindexCatalogue",code_namespace="bookshelf.StandardTasks",error="none",exception="none",outcome="SUCCESS"} 0.002239042
tasks_scheduled_execution_active_seconds_count{code_function="reindexCatalogue",...,outcome="UNKNOWN"} 0The low-cardinality tags are code.function, code.namespace, exception and outcome (SUCCESS, ERROR or UNKNOWN), read from DefaultScheduledTaskObservationConvention. So @Scheduled gets duration, outcome and exception for free, and nothing of the kind exists for Quartz jobs: the tasks.scheduled.execution observation applies only to tasks registered with Spring’s own registrar and never fires for a Quartz job (the tasks_scheduled_execution series of the same run contain only the @Scheduled method and none of the Quartz job classes). The listener-based meters of the next section close that gap, and they deliberately use a similar shape (a timer with an outcome tag) so that one dashboard can show both worlds. What @Scheduled still lacks (a persisted last fire time, a cluster-wide view, misfire accounting) is the content of Standard Scheduling vs Quartz; its locking companion is on Scheduling & ShedLock.
Metrics: Spring Boot has none, so build them
On a fresh application with the Actuator and Micrometer on the classpath, the registry contained no meter whose name contains quartz, and no bean related to a Quartz health indicator existed; the only Quartz beans were the auto-configuration, the quartzScheduler bean and the properties (measured, and confirmed by listing the Quartz classes of the Boot 3.5.16 and 4.1.1 Actuator and auto-configuration jars: only the endpoint and its properties). Nothing in Micrometer binds a Quartz scheduler either. The pipeline that the next sections build is this:
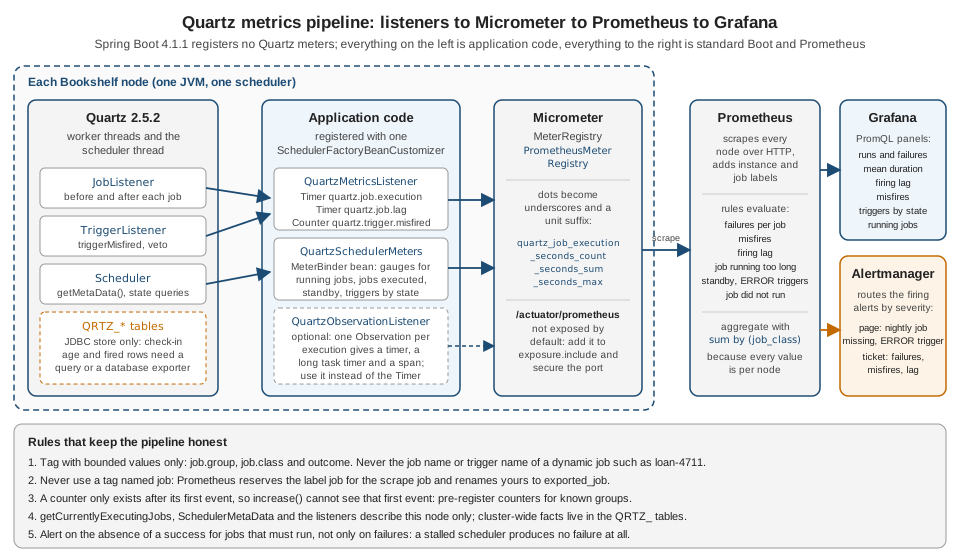
The listener: duration, outcome, lag, misfires and last success
One class implements both JobListener and TriggerListener (the listener contract and its registration are on Listeners & Plugins). jobToBeExecuted stores the start time in the JobExecutionContext (its put and get hold values for the length of one execution); jobWasExecuted records a Timer with the outcome (exception is non-null when the job threw a JobExecutionException), the lag between the time the trigger was due and the time it fired, and a gauge with the epoch second of the last success; triggerMisfired counts misfires.
import java.time.Duration;
import java.time.Instant;
import java.util.Map;
import java.util.concurrent.ConcurrentHashMap;
import java.util.concurrent.atomic.AtomicLong;

import io.micrometer.core.instrument.Gauge;
import io.micrometer.core.instrument.MeterRegistry;
import io.micrometer.core.instrument.Tags;
import io.micrometer.core.instrument.Timer;
import org.quartz.JobExecutionContext;
import org.quartz.JobExecutionException;
import org.quartz.JobListener;
import org.quartz.Trigger;
import org.quartz.Trigger.CompletedExecutionInstruction;
import org.quartz.TriggerListener;

/**
 * Micrometer meters from Quartz callbacks: Spring Boot registers none.
 * Tags are bounded on purpose: the job group and the job class, never the job name or the trigger name.
 */
public class QuartzMetricsListener implements JobListener, TriggerListener {

    private static final String START_NANOS = QuartzMetricsListener.class.getName() + ".startNanos";

    private final MeterRegistry registry;
    private final Map<String, AtomicLong> lastSuccess = new ConcurrentHashMap<>();

    public QuartzMetricsListener(MeterRegistry registry) {
        this.registry = registry;
    }

    @Override
    public String getName() {
        return "bookshelf-metrics";
    }

    private static Tags jobTags(JobExecutionContext context) {
        return Tags.of("job.group", context.getJobDetail().getKey().getGroup(),
                "job.class", context.getJobDetail().getJobClass().getSimpleName());
    }

    // JobListener

    @Override
    public void jobToBeExecuted(JobExecutionContext context) {
        context.put(START_NANOS, System.nanoTime());
    }

    @Override
    public void jobExecutionVetoed(JobExecutionContext context) {
        registry.counter("quartz.job.vetoed", jobTags(context)).increment();
    }

    @Override
    public void jobWasExecuted(JobExecutionContext context, JobExecutionException exception) {
        Long start = (Long) context.get(START_NANOS);
        if (start != null) {
            Timer.builder("quartz.job.execution")
                    .description("Duration of Quartz job executions")
                    .tags(jobTags(context))
                    .tag("outcome", exception == null ? "success" : "failure")
                    .register(registry)
                    .record(Duration.ofNanos(System.nanoTime() - start));
        }
        if (exception == null) {
            String key = context.getJobDetail().getKey().getGroup() + "/" + context.getJobDetail().getJobClass().getSimpleName();
            lastSuccess.computeIfAbsent(key, k -> {
                AtomicLong epochSeconds = new AtomicLong();
                Gauge.builder("quartz.job.last.success.timestamp", epochSeconds, AtomicLong::get)
                        .baseUnit("seconds").tags(jobTags(context)).register(registry);
                return epochSeconds;
            }).set(Instant.now().getEpochSecond());
        }
        if (context.getScheduledFireTime() != null) {
            long lagMillis = Math.max(0, context.getFireTime().getTime() - context.getScheduledFireTime().getTime());
            Timer.builder("quartz.job.lag")
                    .description("Time between the moment a trigger was due and the moment it fired")
                    .tags(jobTags(context))
                    .register(registry)
                    .record(Duration.ofMillis(lagMillis));
        }
    }

    // TriggerListener

    @Override
    public void triggerMisfired(Trigger trigger) {
        registry.counter("quartz.trigger.misfired", "trigger.group", trigger.getKey().getGroup()).increment();
    }

    @Override
    public void triggerFired(Trigger trigger, JobExecutionContext context) {
    }

    @Override
    public boolean vetoJobExecution(Trigger trigger, JobExecutionContext context) {
        return false;
    }

    @Override
    public void triggerComplete(Trigger trigger, JobExecutionContext context, CompletedExecutionInstruction instruction) {
    }
}The tag choices matter more than the code. The tags are job.group, job.class and outcome, all of them bounded. The job name is deliberately not a tag, because the Bookshelf also creates one job per loan (loan-<loanId> in the group reminders, see Dynamic Scheduling & Management) and a tag with a new value per loan would create a new time series per loan, which is the classic way to overload a metrics backend. The tag is also not called job: Prometheus adds a label job (the scrape job) to every series, and a conflicting label of the application is renamed to exported_job unless the scrape is configured to honour labels. The lag is the difference of two timestamps of the JobExecutionContext (getFireTime minus getScheduledFireTime), so it measures the time between the trigger being due and being fired, not the time the job waited for a free thread; for a scheduler with enough threads it is a few milliseconds, and a growing value is the earliest sign of an overloaded scheduler thread or database.
Registering the listeners
Spring Boot does not pick listeners up as beans (see the listeners page), so they are handed to the SchedulerFactoryBean by a customizer. The configuration below registers the metrics listener, the log-context listener, the observation listener of the tracing section, a scheduler listener that counts schedulerError, the scheduler gauges of the next section and the health indicator of the section after it, all in one place.
import io.micrometer.core.instrument.MeterRegistry;
import io.micrometer.core.instrument.binder.MeterBinder;
import io.micrometer.observation.ObservationRegistry;
import org.quartz.Scheduler;
import org.springframework.beans.factory.ObjectProvider;
import org.springframework.boot.quartz.autoconfigure.SchedulerFactoryBeanCustomizer;
import org.springframework.context.annotation.Bean;
import org.springframework.context.annotation.Configuration;
import org.springframework.jdbc.core.JdbcTemplate;

@Configuration(proxyBeanMethods = false)
public class QuartzObservabilityConfig {

    @Bean
    SchedulerFactoryBeanCustomizer quartzListeners(MeterRegistry meterRegistry, ObservationRegistry observationRegistry) {
        QuartzMetricsListener metrics = new QuartzMetricsListener(meterRegistry);
        return factory -> {
            // the MDC listener is first so that every later listener and the job itself log with the context
            factory.setGlobalJobListeners(new QuartzMdcListener(), metrics, new QuartzObservationListener(observationRegistry));
            factory.setGlobalTriggerListeners(metrics);
            factory.setSchedulerListeners(new QuartzErrorListener(meterRegistry));
        };
    }

    @Bean
    MeterBinder quartzSchedulerMeters(Scheduler scheduler) {
        return new QuartzSchedulerMeters(scheduler);
    }

    @Bean
    QuartzHealthIndicator quartz(Scheduler scheduler, ObjectProvider<JdbcTemplate> jdbcTemplate) {
        return new QuartzHealthIndicator(scheduler, jdbcTemplate.getIfAvailable());
    }
}The registration order is the notification order: Quartz calls jobToBeExecuted on the listeners in the order they were registered, and the log-context listener comes first so that every later listener, and the job itself, logs with the context already set. setSchedulerListeners is inherited from Spring’s SchedulerAccessor, like setGlobalJobListeners and setGlobalTriggerListeners. The one listener for scheduler-level failures is small and worth having: it increments a counter every time Quartz reports a schedulerError, which is how the "a listener throws and the job silently does not run" case of the listeners page becomes visible.
import io.micrometer.core.instrument.MeterRegistry;
import org.quartz.SchedulerException;
import org.quartz.listeners.SchedulerListenerSupport;

/** Counts what Quartz reports through schedulerError: a listener bug, a store failure, a job that could not run. */
public class QuartzErrorListener extends SchedulerListenerSupport {

    private final MeterRegistry registry;

    public QuartzErrorListener(MeterRegistry registry) {
        this.registry = registry;
    }

    @Override
    public void schedulerError(String msg, SchedulerException cause) {
        registry.counter("quartz.scheduler.errors").increment();
        getLog().warn("Quartz reported a scheduler error: {}", msg, cause);
    }
}
Source: Quartz API: SchedulerListener
With a deliberately buggy jobToBeExecuted listener added after start-up, the counter quartz.scheduler.errors reached 9 in about ten seconds while the jobs of the group no longer ran, and each error was logged by this listener with the message "Unable to notify JobListener(s) of Job to be executed: … (Job will NOT be executed!)" (measured).
Scheduler-level gauges with a MeterBinder
State that is not an event (is the scheduler in standby, how many jobs are running, how many triggers are in the ERROR state) belongs in gauges. A MeterBinder bean is bound to the registry by Spring Boot; each gauge reads from the Scheduler when scraped.
import java.util.EnumMap;
import java.util.Map;
import java.util.function.Supplier;

import io.micrometer.core.instrument.FunctionCounter;
import io.micrometer.core.instrument.Gauge;
import io.micrometer.core.instrument.MeterRegistry;
import io.micrometer.core.instrument.binder.MeterBinder;
import org.quartz.Scheduler;
import org.quartz.SchedulerException;
import org.quartz.Trigger.TriggerState;
import org.quartz.impl.matchers.GroupMatcher;

/** Scheduler-level meters; every value is read from this node only. */
public class QuartzSchedulerMeters implements MeterBinder {

    private final Scheduler scheduler;
    private final Supplier<Map<TriggerState, Integer>> triggerStates;

    public QuartzSchedulerMeters(Scheduler scheduler) {
        this.scheduler = scheduler;
        this.triggerStates = cached(30_000, this::countTriggerStates);
    }

    @Override
    public void bindTo(MeterRegistry registry) {
        Gauge.builder("quartz.scheduler.jobs.running", scheduler, s -> value(() -> s.getCurrentlyExecutingJobs().size()))
                .description("Jobs executing on this node right now").register(registry);
        FunctionCounter.builder("quartz.scheduler.jobs.executed", scheduler, s -> value(() -> s.getMetaData().getNumberOfJobsExecuted()))
                .description("Jobs executed by this scheduler instance since it started").register(registry);
        Gauge.builder("quartz.scheduler.standby", scheduler, s -> value(() -> s.isInStandbyMode() ? 1 : 0))
                .description("1 when the scheduler is in standby and fires nothing").register(registry);
        for (TriggerState state : TriggerState.values()) {
            Gauge.builder("quartz.triggers", triggerStates, t -> t.get().getOrDefault(state, 0))
                    .tag("state", state.name().toLowerCase())
                    .description("Triggers by state, refreshed at most every 30 seconds").register(registry);
        }
    }

    private Map<TriggerState, Integer> countTriggerStates() {
        Map<TriggerState, Integer> counts = new EnumMap<>(TriggerState.class);
        try {
            for (var key : scheduler.getTriggerKeys(GroupMatcher.anyTriggerGroup())) {
                counts.merge(scheduler.getTriggerState(key), 1, Integer::sum);
            }
        } catch (SchedulerException e) {
            // keep the gauge readable even when the store is unreachable
        }
        return counts;
    }

    private interface Reading { Number read() throws SchedulerException; }

    private static double value(Reading reading) {
        try {
            return reading.read().doubleValue();
        } catch (SchedulerException e) {
            return Double.NaN;
        }
    }

    private static <T> Supplier<T> cached(long ttlMillis, Supplier<T> delegate) {
        return new Supplier<>() {
            private volatile T value;
            private volatile long loadedAt;
            @Override
            public synchronized T get() {
                long now = System.currentTimeMillis();
                if (value == null || now - loadedAt > ttlMillis) {
                    value = delegate.get();
                    loadedAt = now;
                }
                return value;
            }
        };
    }
}
Source: Micrometer: Gauges
Three design points are in the code. Every reading is a Scheduler call that can throw a SchedulerException; the gauge then returns NaN instead of failing the scrape. The getTriggerState loop costs one store query per trigger, so the result is cached for 30 seconds: with a JDBC store and thousands of reminder triggers a gauge that queried the store on every scrape would be a load of its own; at that size prefer a single SELECT TRIGGER_STATE, COUNT() … GROUP BY against the store (see the database section below). And getCurrentlyExecutingJobs and getNumberOfJobsExecuted are *node-local: the gauge quartz.scheduler.jobs.running answers "how many jobs does this node run", and the dashboard sums it over the nodes.
What comes out
The test project was run with the Actuator and the Prometheus registry (io.micrometer:micrometer-registry-prometheus, version 1.17.1 managed by Boot; prometheus added to management.endpoints.web.exposure.include). The OverdueLoanRemindersJob of the test project fails every third run on purpose, and the misfires were provoked as in the earlier measurement: org.quartz.jobStore.misfireThreshold set to 1000 ms and the scheduler put into standby for 3.5 seconds with scheduler.standby() and restarted with scheduler.start(). GET /actuator/prometheus then contained (abbreviated, HELP and TYPE lines removed):
quartz_job_execution_seconds_count{job_class="CacheRefreshJob",job_group="bookshelf",outcome="success"} 27
quartz_job_execution_seconds_sum{job_class="CacheRefreshJob",job_group="bookshelf",outcome="success"} 0.039196921
quartz_job_execution_seconds_count{job_class="OverdueLoanRemindersJob",job_group="bookshelf",outcome="failure"} 5
quartz_job_execution_seconds_count{job_class="OverdueLoanRemindersJob",job_group="bookshelf",outcome="success"} 10
quartz_job_execution_seconds_max{job_class="OverdueLoanRemindersJob",job_group="bookshelf",outcome="failure"} 0.004814875
quartz_job_lag_seconds_count{job_class="CacheRefreshJob",job_group="bookshelf"} 27
quartz_job_lag_seconds_sum{job_class="CacheRefreshJob",job_group="bookshelf"} 0.444
quartz_job_lag_seconds_max{job_class="CacheRefreshJob",job_group="bookshelf"} 0.353
quartz_job_last_success_timestamp_seconds{job_class="CacheRefreshJob",job_group="bookshelf"} 1.791199962E9
quartz_trigger_misfired_total{trigger_group="bookshelf"} 3.0
quartz_scheduler_jobs_executed_total 42.0
quartz_scheduler_jobs_running 0.0
quartz_scheduler_standby 0.0
quartz_triggers{state="normal"} 4.0
quartz_triggers{state="error"} 0.0
quartz_triggers{state="paused"} 0.0
Source: Micrometer: Prometheus
The Prometheus names show the translation rules: dots become underscores, a Timer becomes _seconds_count, _seconds_sum and _seconds_max, a counter gets _total, and the base unit of a gauge is appended. Only count, sum and max exist by default; a histogram (for quantiles across nodes) is switched on by name through Boot’s distribution properties. With management.metrics.distribution.percentiles-histogram.quartz.job.execution=true the same run exposed 216 quartz_job_execution_seconds_bucket series for two job classes, which is why it is off by default and best enabled only for the jobs whose duration distribution matters. The same series are available without Prometheus through /actuator/metrics/quartz.job.execution, where a tag filter works as usual (?tag=outcome:failure returned COUNT 5.0 in the run above).
Dashboards and rules need aggregations over instances, because every node reports itself. The queries below ran against a real Prometheus scraping the lab (the panel titles are what a Grafana panel would call them; Grafana itself was not run):
# Executions per minute, by job and outcome
sum by (job_class, outcome) (rate(quartz_job_execution_seconds_count[5m])) * 60

# Mean duration of an execution, by job
sum by (job_class) (rate(quartz_job_execution_seconds_sum[5m]))
  / sum by (job_class) (rate(quartz_job_execution_seconds_count[5m]))

# Mean firing lag, by job
sum by (job_class) (rate(quartz_job_lag_seconds_sum[5m]))
  / sum by (job_class) (rate(quartz_job_lag_seconds_count[5m]))

# Failure ratio over the last hour
sum by (job_class) (increase(quartz_job_execution_seconds_count{outcome="failure"}[1h]))
  / sum by (job_class) (increase(quartz_job_execution_seconds_count[1h]))

# Triggers by state, summed over the nodes of the cluster
sum by (state) (quartz_triggers)

# Jobs running right now on all nodes
sum(quartz_scheduler_jobs_running)
Source: Prometheus: Query functions
In the run, the first query returned about 36 executions per minute for the cache refresh and about 12 and 5 for the successes and failures of the reminders, the failure ratio for the reminders job was 0.2857 (2 of 7 runs in the hour), and the mean duration and lag were well below a millisecond and 4 milliseconds. See PromQL functions and Grafana dashboards for the query and dashboard background.
Health: a HealthIndicator for the scheduler
A health indicator answers a different question from a metric: should this instance receive traffic, or be restarted? For a scheduler there are three honest states: running (UP), deliberately not firing (standby, or not started yet: OUT_OF_SERVICE) and broken (shut down, or the store cannot be reached: DOWN). With a clustered JDBC store a fourth fact matters: whether this node still checks in. A node whose LAST_CHECKIN_TIME is older than the check-in interval plus the 7.5-second grace that JobStoreSupport adds is a node its peers will treat as failed and recover (see Clustering); the indicator reads its own row.
import java.util.List;

import org.quartz.Scheduler;
import org.quartz.SchedulerException;
import org.quartz.SchedulerMetaData;
import org.springframework.boot.health.contributor.Health;
import org.springframework.boot.health.contributor.HealthIndicator;
import org.springframework.jdbc.core.JdbcTemplate;

/** Health of this node's scheduler: shut down, standby, and (JDBC cluster only) a stale check-in row. */
public class QuartzHealthIndicator implements HealthIndicator {

    /** The grace period peers add before they declare a node dead (JobStoreSupport, not configurable). */
    private static final long FAILOVER_GRACE_MILLIS = 7_500;

    private final Scheduler scheduler;
    private final JdbcTemplate jdbcTemplate; // null when the job store is not JDBC

    public QuartzHealthIndicator(Scheduler scheduler, JdbcTemplate jdbcTemplate) {
        this.scheduler = scheduler;
        this.jdbcTemplate = jdbcTemplate;
    }

    @Override
    public Health health() {
        try {
            SchedulerMetaData meta = scheduler.getMetaData();
            Health.Builder builder;
            if (meta.isShutdown()) {
                builder = Health.down().withDetail("reason", "scheduler is shut down");
            } else if (!meta.isStarted()) {
                builder = Health.outOfService().withDetail("reason", "scheduler has not been started");
            } else if (meta.isInStandbyMode()) {
                builder = Health.outOfService().withDetail("reason", "scheduler is in standby");
            } else {
                builder = Health.up();
            }
            builder.withDetail("schedulerName", meta.getSchedulerName())
                    .withDetail("instanceId", meta.getSchedulerInstanceId())
                    .withDetail("jobsExecuted", meta.getNumberOfJobsExecuted());
            if (meta.isJobStoreClustered() && jdbcTemplate != null && !meta.isShutdown()) {
                addCheckIn(builder, meta);
            }
            return builder.build();
        } catch (SchedulerException | RuntimeException e) {
            return Health.down(e).build();
        }
    }

    private void addCheckIn(Health.Builder builder, SchedulerMetaData meta) {
        List<long[]> rows = jdbcTemplate.query(
                "SELECT LAST_CHECKIN_TIME, CHECKIN_INTERVAL FROM QRTZ_SCHEDULER_STATE WHERE SCHED_NAME = ? AND INSTANCE_NAME = ?",
                (rs, i) -> new long[] { rs.getLong(1), rs.getLong(2) },
                meta.getSchedulerName(), meta.getSchedulerInstanceId());
        if (rows.isEmpty()) {
            builder.down().withDetail("checkIn", "no row in QRTZ_SCHEDULER_STATE for this instance");
            return;
        }
        long age = System.currentTimeMillis() - rows.get(0)[0];
        builder.withDetail("lastCheckInAgeMillis", age);
        if (age > rows.get(0)[1] + FAILOVER_GRACE_MILLIS) {
            builder.down().withDetail("checkIn", "stale: peers consider this node failed");
        }
    }
}
Source: Spring Boot API: HealthIndicator
The bean is named quartz in the configuration above, so Boot publishes it as the component quartz of /actuator/health. The imports are the Spring Boot 4 ones: Health and HealthIndicator live in org.springframework.boot.health.contributor, where Spring Boot 3.5 has them in org.springframework.boot.actuate.health. The four situations were produced and measured:
| Situation | GET /actuator/health/quartz |
HTTP | Why |
|---|---|---|---|
RAM store, running |
|
200 |
Started, not in standby |
|
|
503 |
|
JDBC cluster, healthy |
|
200 |
Check-in 956 ms ago, interval 2000 ms |
JDBC cluster, check-in row aged by an |
|
503 |
Age 124 s is above 2000 ms plus 7500 ms |
Two operational decisions come with the indicator. First, which probe it belongs to. A failing Quartz check on the liveness probe makes Kubernetes restart the pod, which is wrong when the cause is a database outage that the restart cannot fix; the readiness group is the right place, and management.endpoint.health.group.readiness.include=readinessState,quartz made /actuator/health/readiness report the component (measured: status UP, components quartz and readinessState). For the probe background see Health Probes & Lifecycle. Second, the indicator is not a replacement for the alert on a job that did not run: a scheduler that is started, not in standby and checking in can still have a trigger in the ERROR state or a thread pool that is saturated, which the metrics and the table queries below catch.
Logs: the history plugins and the job key in the MDC
Quartz’s own log lines (scheduler start, misfire handling, cluster recovery) use SLF4J and appear in the application log under org.quartz. For a line per execution there are the two history plugins LoggingJobHistoryPlugin and LoggingTriggerHistoryPlugin; their properties, message formats and output are on Listeners & Plugins, and the verdict there stands: three INFO lines per execution are fine for a development or low-volume scheduler and too noisy for a job that fires every second. What the plugins cannot do is label the job’s own log lines. A log line such as "Sent overdue-loan reminders" says nothing about which trigger, which fire or which node produced it, and with several jobs running in parallel on a pool of worker threads the thread name is the only hint.
The MDC (the SLF4J mapped diagnostic context, a thread-local map that the log pattern can print) solves it, and a JobListener is the natural place to fill it, because jobToBeExecuted, the job and jobWasExecuted all run on the same worker thread (read from JobRunShell; the sequence is in the tracing section below).
import org.quartz.JobExecutionContext;
import org.quartz.JobExecutionException;
import org.quartz.listeners.JobListenerSupport;
import org.slf4j.MDC;

/** Puts the job key, the trigger key and the fire instance id into the MDC of the worker thread that runs the job. */
public class QuartzMdcListener extends JobListenerSupport {

    @Override
    public String getName() {
        return "bookshelf-mdc";
    }

    @Override
    public void jobToBeExecuted(JobExecutionContext context) {
        MDC.put("quartz.job", context.getJobDetail().getKey().toString());
        MDC.put("quartz.trigger", context.getTrigger().getKey().toString());
        MDC.put("quartz.fireId", context.getFireInstanceId());
    }

    @Override
    public void jobExecutionVetoed(JobExecutionContext context) {
        clear();
    }

    @Override
    public void jobWasExecuted(JobExecutionContext context, JobExecutionException exception) {
        clear();
    }

    private static void clear() {
        MDC.remove("quartz.job");
        MDC.remove("quartz.trigger");
        MDC.remove("quartz.fireId");
    }
}The log pattern prints the context with %X; Spring Boot’s logging.pattern.level is the property to extend (see Logging for the rest of the logging set-up):
logging:
  pattern:
    level: "%5p [%X{quartz.job:-}]"
Source: Spring Boot: Logging
The measured log lines of the test project (the application name, thread and trace columns are Boot’s; the bracket after the level is the MDC). The lines of the Quartz jobs carry the job key and the @Scheduled line, which has no Quartz context, prints an empty bracket:
2026-10-05T13:28:17.107+02:00  INFO [bookshelf.cacheRefresh] 93841 --- [bookshelf] [eduler_Worker-1] [6ac389d1318944731b375454e2ee45ce-1b375454e2ee45ce] bookshelf.CacheRefreshJob                : Refreshing the catalogue cache
2026-10-05T13:28:18.010+02:00  INFO [bookshelf.overdueLoanReminders] 93841 --- [bookshelf] [eduler_Worker-4] [6ac389d2d2183d09886dff48e670948a-886dff48e670948a] bookshelf.OverdueLoanRemindersJob        : Sent overdue-loan reminders, run 2
2026-10-05T13:28:20.006+02:00  WARN [bookshelf.overdueLoanReminders] 93841 --- [bookshelf] [eduler_Worker-7] [6ac389d436cd04e03cf3be6307e01cef-3cf3be6307e01cef] bookshelf.OverdueLoanRemindersJob        : Mail server unreachable, run 3 failed
2026-10-05T13:28:18.073+02:00  INFO [] 93841 --- [bookshelf] [   scheduling-1] [6ac389d2...] bookshelf.StandardTasks                  : Reindexing the catalogue search
Source: Spring Boot: Logging
With structured logging no pattern is needed: Spring Boot’s structured formats (logging.structured.format.console) write the whole MDC as fields. With the logstash format the same job produced one JSON object per line, with the three MDC keys next to the trace and span ids (reformatted for reading):
{
  "@timestamp": "2026-10-05T13:23:53.290611+02:00",
  "message": "Sent overdue-loan reminders, run 1",
  "logger_name": "bookshelf.OverdueLoanRemindersJob",
  "thread_name": "quartzScheduler_Worker-1",
  "level": "INFO",
  "traceId": "6ac388c9d5dec02adbf93ac5911c931d",
  "spanId": "dbf93ac5911c931d",
  "quartz.trigger": "bookshelf.overdueLoanRemindersTrigger",
  "quartz.fireId": "1791199432983",
  "quartz.job": "bookshelf.overdueLoanReminders"
}
Source: Spring Boot: Logging
Three traps belong to the MDC. It is a thread-local, so work the job hands to another thread (an executor, CompletableFuture) does not carry the context unless that pool copies it. The listener must clean up: jobExecutionVetoed and jobWasExecuted do, but if a listener registered after this one throws in jobToBeExecuted the job does not run and jobWasExecuted is never called (see "When a listener fails" on the listeners page), so the key stays on the worker thread until the next job on that thread overwrites it; that is visible in the lab: the error logged by the scheduler listener carried the key of the job that never ran. Wrap the body of every other listener in a try/catch. And the fire id is not a UUID: the RAM store hands out a counter seeded from the clock, and the JDBC store the instance id followed by such a counter (getFiredTriggerRecordId in both stores), so it identifies one firing of one scheduler and means little without the instance name.
Tracing a job execution
A trace follows one unit of work across code and services. A Quartz job has a property that makes it special: nothing calls it. There is no incoming HTTP request to carry a trace context, so without help every job execution starts and ends without a trace, and the calls the job makes (a database, a mail service) cannot be tied to the execution that caused them. The fix is again a listener, this time one that opens a Micrometer Observation for each execution. An observation is Micrometer’s single instrument for timing and tracing: the same start and stop produce a timer through the metrics handler and a span through the tracing handler, so one listener gives both and replaces the Timer of the metrics listener if tracing is wanted.
import io.micrometer.observation.Observation;
import io.micrometer.observation.ObservationRegistry;
import org.quartz.JobExecutionContext;
import org.quartz.JobExecutionException;
import org.quartz.listeners.JobListenerSupport;

/** One Micrometer observation per job execution: a timer for metrics and a span for tracing from one instrument. */
public class QuartzObservationListener extends JobListenerSupport {

    private static final String OBSERVATION = QuartzObservationListener.class.getName() + ".observation";
    private static final String SCOPE = QuartzObservationListener.class.getName() + ".scope";

    private final ObservationRegistry registry;

    public QuartzObservationListener(ObservationRegistry registry) {
        this.registry = registry;
    }

    @Override
    public String getName() {
        return "bookshelf-observation";
    }

    @Override
    public void jobToBeExecuted(JobExecutionContext context) {
        Observation observation = Observation.createNotStarted("quartz.job", registry)
                .contextualName("quartz job " + context.getJobDetail().getKey().getName())
                .lowCardinalityKeyValue("job.group", context.getJobDetail().getKey().getGroup())
                .lowCardinalityKeyValue("job.class", context.getJobDetail().getJobClass().getSimpleName())
                .highCardinalityKeyValue("job.key", context.getJobDetail().getKey().toString())
                .highCardinalityKeyValue("quartz.fire.id", context.getFireInstanceId())
                .start();
        context.put(OBSERVATION, observation);
        context.put(SCOPE, observation.openScope());
    }

    @Override
    public void jobWasExecuted(JobExecutionContext context, JobExecutionException exception) {
        Observation.Scope scope = (Observation.Scope) context.get(SCOPE);
        Observation observation = (Observation) context.get(OBSERVATION);
        if (scope != null) {
            scope.close();
        }
        if (observation != null) {
            if (exception != null) {
                observation.error(exception);
            }
            observation.stop();
        }
    }

    @Override
    public void jobExecutionVetoed(JobExecutionContext context) {
        Observation.Scope scope = (Observation.Scope) context.get(SCOPE);
        Observation observation = (Observation) context.get(OBSERVATION);
        if (scope != null) {
            scope.close();
        }
        if (observation != null) {
            observation.stop();
        }
    }
}
Source: Micrometer: Observation
The scope matters. openScope makes the span current on this thread, so the log lines of the job get the trace id and any outgoing call the job makes through an instrumented client joins the trace; jobWasExecuted closes the scope on the same thread and stops the observation (with error(exception) when the job failed, which becomes the error tag and the span’s error). The lab added io.micrometer:micrometer-tracing-bridge-brave and org.springframework.boot:spring-boot-micrometer-tracing-brave (any bridge works; the OpenTelemetry route is described on Metrics & Observability) and set management.tracing.sampling.probability to 1.0, because the default samples only a tenth of the traces. Spring Boot then added the trace and span id to every log line (the bracket after the thread column in the log lines above) and, because both the metrics and the tracing handler are present, the observation also produced a timer and a long-task timer:
quartz_job_seconds_count{error="JobExecutionException",job_class="OverdueLoanRemindersJob",job_group="bookshelf"} 5
quartz_job_seconds_count{error="none",job_class="CacheRefreshJob",job_group="bookshelf"} 27
quartz_job_seconds_sum{error="none",job_class="CacheRefreshJob",job_group="bookshelf"} 0.029174667
quartz_job_active_seconds_count{job_class="CacheRefreshJob",job_group="bookshelf"} 0
quartz_job_active_seconds_max{job_class="CacheRefreshJob",job_group="bookshelf"} 0.0
Source: Micrometer Tracing
The long-task timer (quartz_job_active_seconds_*) is the one that tells you a job is running now and for how long: its max is the age of the oldest running execution, which is the signal behind the "job running too long" alert below. With an 8-second job in the lab the series read quartz_job_active_seconds_count 1 and quartz_job_active_seconds_max 2.8185435 2.8 seconds into the run and 0.0 after it finished (measured). The lab ran both the metrics listener and the observation listener to show both outputs; in a real application pick one of the two timers (the observation is the better choice when tracing is on, the plain timer when it is not).
The sequence for one execution, in the order the listeners were registered (read from JobRunShell and the registration order above), is the following. The trigger listeners run before the job listeners, the job listeners are notified in registration order on both sides, and the trigger listeners are completed last:
Two limits of tracing deserve a sentence each. Every execution is a root span: Quartz does not propagate a trace from the code that scheduled the job, so a reminder scheduled in an HTTP request and fired a week later is not linked to that request. If the link matters, store the trace id of the scheduling request as a JobDataMap entry and attach it to the observation as a high-cardinality key-value in the listener; the span is then searchable by the id of the request that created the reminder. And high-cardinality values (the full job key, the fire id) go into highCardinalityKeyValue, which tracing keeps and the metrics handler drops, so the job key can be on the span without exploding the timer’s tags.
JMX
Quartz can register the scheduler as an MBean in the platform MBean server. It is off in the Quartz default and, under Spring Boot, is switched on through the raw Quartz properties (Boot’s spring.quartz.properties map, see Spring Boot Configuration):
spring:
  quartz:
    properties:
org.quartz.scheduler.jmx.export: "true"The keys org.quartz.scheduler.jmx.export, org.quartz.scheduler.jmx.objectName and the two jmx.proxy keys are read from the 2.5.2 source of StdSchedulerFactory; the Quartz configuration reference does not describe them. The default object name is quartz:type=QuartzScheduler,name=<scheduler name>,instance=<instance id> (QuartzSchedulerResources.generateJMXObjectName), so a cluster exports one MBean per node, each with its own instance id. The lab read the MBean through the standard javax.management API in the same JVM, 12 seconds after start (the attributes of the interface QuartzSchedulerMBean; instance id and name are those of the RAM store):
MBean quartz:type=QuartzScheduler,name=quartzScheduler,instance=NON_CLUSTERED
  SchedulerName = quartzScheduler
  SchedulerInstanceId = NON_CLUSTERED
  Version = 2.5.2
  JobStoreClassName = org.quartz.simpl.RAMJobStore
  ThreadPoolClassName = org.quartz.simpl.SimpleThreadPool
  ThreadPoolSize = 10
  Started = true
  StandbyMode = false
  Shutdown = false
  SampledStatisticsEnabled = true
  JobsExecutedMostRecentSample = 2
  JobsCompletedMostRecentSample = 2
  JobsScheduledMostRecentSample = 0
  PerformanceMetrics = {JobsCompleted=2, JobsScheduled=0, JobsExecuted=2}
  operation getTriggerState("overdueLoanRemindersTrigger", "bookshelf") = NORMAL
Source: Quartz API: QuartzSchedulerMBean
Four properties of the MBean decide how useful it is. The MostRecentSample attributes and PerformanceMetrics are *sampled statistics and are empty until SampledStatisticsEnabled is set to true (it is false by default; the lab switched it on and waited for a sample period before reading). The MBean has operations, not only attributes: the lab listed triggerJob, pauseJobGroup, pauseAllTriggers, resumeJob, deleteJob, unscheduleJob, interruptJob, standby, shutdown and more, so unlike the Actuator endpoint JMX can pause and delete, which makes it a management interface that must be as protected as the application itself (never expose a JMX port without authentication and TLS). It is per node, like the listeners. And it is the right tool for an interactive look with jconsole or a JMX exporter, and the wrong one for dashboards and alerts, where the Micrometer meters above are easier to aggregate; Quartz also offers a JMX proxy scheduler (the jmx.proxy keys) that lets a client scheduler operate a remote one through these MBeans, which is a management tool and not part of observability.
Looking at the job store
With a JDBC store the QRTZ_ tables are the one place that knows the whole cluster, and four read-only queries answer most operational questions. They are reads: nothing on this page writes to the Quartz tables, because the scheduler owns them (see Job Stores & Persistence). The queries were run against the PostgreSQL 17 database of the verification project with the lab application (JDBC store, clustered, PostgreSQLDelegate); the time arithmetic is PostgreSQL’s, and the instance id is shortened.
SELECT instance_name, checkin_interval,
       (extract(epoch FROM now()) * 1000)::bigint - last_checkin_time AS checkin_age_ms
FROM qrtz_scheduler_state
WHERE sched_name = 'BookshelfCluster'; instance_name | checkin_interval | checkin_age_ms
-------------------+------------------+----------------
host1791199243080 | 2000 | 1771SELECT trigger_state, count(*)
FROM qrtz_triggers
WHERE sched_name = 'BookshelfCluster'
GROUP BY trigger_state ORDER BY 1; trigger_state | count
---------------+-------
ACQUIRED | 1
WAITING | 3SELECT count(*) AS overdue_triggers,
coalesce(max((extract(epoch FROM now()) * 1000)::bigint - next_fire_time), 0) AS max_lateness_ms
FROM qrtz_triggers
WHERE sched_name = 'BookshelfCluster' AND trigger_state = 'WAITING'
AND next_fire_time < (extract(epoch FROM now()) * 1000)::bigint - 5000; overdue_triggers | max_lateness_ms
------------------+-----------------
0 | 0SELECT instance_name, job_name, state,
(extract(epoch FROM now()) * 1000)::bigint - fired_time AS running_ms
FROM qrtz_fired_triggers
WHERE sched_name = 'BookshelfCluster'
ORDER BY fired_time; instance_name | job_name | state | running_ms
-------------------+----------+----------+------------
host1791199243080 | | ACQUIRED | 602The QRTZ_FIRED_TRIGGERS result shows what a healthy table looks like: a row in the ACQUIRED state (the trigger a node has claimed and will fire next, with a NULL job name) and, while a job runs, a row in the EXECUTING state for it. A row that stays EXECUTING for far longer than the job takes, or a row whose instance_name is no longer in QRTZ_SCHEDULER_STATE, is a job that hung or a node that died; after a crash the survivor’s recovery deletes the dead node’s rows once it declares the node failed. The four queries are the basis for a database exporter or for a MeterBinder that reads the store directly (preferable to the API-based trigger-state gauge when the store holds thousands of triggers). Do not run them against a production store without an index-friendly sched_name predicate, as written, and keep their frequency modest; they take no Quartz lock, but a heavy query on the store a scheduler depends on is not free.
Alerting
An alert is useful when it fires for a condition a person can act on, and a scheduler has a characteristic failure that is silent: when it stops firing it produces no error at all. Two kinds of alert are needed, and the second is the one that gets forgotten. Something went wrong alerts fire on events (a failure, a misfire, a scheduler error). Something did not happen alerts fire on the absence of a success, a fire time or a check-in. The table lists the alerts of the Bookshelf and their sources; the rules that follow implement the Prometheus ones and were checked with promtool check rules (8 rules found, no errors), and their expressions were run against a live Prometheus.
| Alert | Signal | Notes |
|---|---|---|
A job failed |
|
Ticket severity. A job that is retried by its own trigger is fine until the ratio stays high |
The nightly reminders did not run |
|
Page severity. This is the alert that catches a stalled scheduler, a paused trigger and a lost job store |
The weekly or monthly job did not run |
|
Prometheus keeps 15 days by default, so |
A trigger misfired |
|
The scheduler was stalled, out of threads or the node was down longer than the threshold. Pre-register the counter so the first misfire is counted |
Jobs start late |
Mean of |
Overloaded scheduler thread, saturated database or too few worker threads |
A job runs for too long |
|
Long-task timer: the age of the oldest running execution |
The scheduler is in standby |
|
Standby is normal during a maintenance window and wrong afterwards |
A trigger is in the |
|
Page severity: an |
A node stopped checking in |
Check-in age above the interval plus 7.5 s (health indicator, or the query above) |
The cluster will fail the node over after that time; an alert after the interval tells you before the users notice |
Quartz logged a cluster recovery |
The WARN log line |
Read from the 2.5.2 source: logged at WARN when a node was declared failed; the follow-up lines say how many triggers were freed and how many recoverable jobs were scheduled again |
A node was recovered but is alive |
The WARN line |
Clock skew, a paused JVM or a database stall made peers declare a live node failed; the node must be restarted |
Quartz reported an error |
|
A listener that throws silently stops jobs from running (see the listeners page) |
groups:
  - name: bookshelf-quartz
    rules:
      - alert: QuartzJobFailed
        expr: sum by (job_class) (increase(quartz_job_execution_seconds_count{outcome="failure"}[1h])) > 0
        labels:
          severity: ticket
        annotations:
          summary: "Quartz job {{ $labels.job_class }} failed in the last hour"

      - alert: QuartzOverdueRemindersDidNotRun
        expr: |
          increase(quartz_job_execution_seconds_count{job_class="OverdueLoanRemindersJob",outcome="success"}[26h]) == 0
          or absent_over_time(quartz_job_execution_seconds_count{job_class="OverdueLoanRemindersJob",outcome="success"}[26h])
        labels:
          severity: page
        annotations:
          summary: "The nightly overdue-loan reminders have not completed successfully for 26 hours"

      - alert: QuartzWeeklyStatisticsStale
        expr: time() - max by (job_class) (quartz_job_last_success_timestamp_seconds{job_class="WeeklyStatisticsJob"}) > 8 * 86400
        labels:
          severity: ticket
        annotations:
          summary: "The weekly statistics report has not completed for more than eight days"

      - alert: QuartzTriggerMisfired
        expr: sum by (trigger_group) (increase(quartz_trigger_misfired_total[10m])) > 0
        labels:
          severity: ticket
        annotations:
          summary: "Triggers in group {{ $labels.trigger_group }} misfired: the scheduler was stalled or out of threads"

      - alert: QuartzFiringLate
        expr: |
          sum by (job_class) (rate(quartz_job_lag_seconds_sum[5m]))
            / sum by (job_class) (rate(quartz_job_lag_seconds_count[5m])) > 5
        for: 10m
        labels:
          severity: ticket
        annotations:
          summary: "Quartz job {{ $labels.job_class }} starts more than 5 s after it was due"

      - alert: QuartzJobRunningTooLong
        expr: max by (job_class) (quartz_job_active_seconds_max) > 3600
        labels:
          severity: ticket
        annotations:
          summary: "An execution of {{ $labels.job_class }} has been running for more than one hour"

      - alert: QuartzSchedulerInStandby
        expr: max by (instance) (quartz_scheduler_standby) == 1
        for: 15m
        labels:
          severity: ticket
        annotations:
          summary: "The scheduler on {{ $labels.instance }} has been in standby for 15 minutes"

      - alert: QuartzTriggerInErrorState
        expr: max by (instance) (quartz_triggers{state="error"}) > 0
        for: 5m
        labels:
          severity: page
        annotations:
          summary: "A trigger on {{ $labels.instance }} is in the ERROR state and will never fire again until it is reset"
Source: Prometheus: Alerting rules
Three of the alerts in the table depend on facts that were measured and are worth restating. The thread-pool case: with a bounded and rejecting executor the scheduler logged ThreadPool.runInThread() return false! and moved the triggers it could not hand over to the ERROR state (4 of 6 in the test of the Spring Boot configuration page), so a saturated pool shows up first as quartz_triggers with state="error", not as a failing job. The ERROR state is permanent until Scheduler.resetTriggerFromErrorState is called; no timeout resets it. And the misfire counter has the Prometheus subtlety stated in the diagram: a counter series appears only after the first increment, and increase() over a series that first shows up with the value 1 reports 0 for that first event, which is why the lab’s increase(quartz_trigger_misfired_total[10m]) returned 0 although the counter already showed 3 (Prometheus saw the series for the first time at its final value and had no earlier sample to subtract); registering the counter for each known trigger group at start-up (registry.counter(…) with the group tag) makes the first event visible.
Worked example: what to watch for each Bookshelf job
Putting the pieces together for the five jobs of the scenario. The "proof of life" is the signal that says the job ran when it should; it is chosen by the job’s period, because the window of the query must fit inside the retention of the metrics store.
| Job and schedule | Period | Proof of life | Alert |
|---|---|---|---|
|
5 minutes |
|
Mean lag above 5 s for ten minutes; a failure ratio above 50% |
|
1 day |
|
Page if zero; ticket on any failure in the last hour |
|
1 week |
|
Ticket if the last success is older than eight days |
|
1 month |
|
Ticket if older than 32 days; the metrics cannot cover it |
Per-member reminders |
Per loan |
The class tag |
Failures for the class; the |
The three health layers combine as follows: the health indicator in the readiness group takes a node out of rotation when its scheduler is shut down or has stopped checking in; the Prometheus rules page a person for a job that did not run; and the endpoint with previousFireTime is the thing the person opens first, because it shows in one request which triggers are NORMAL, which PAUSED and which ERROR, and when each fired last.
Pitfalls
| Pitfall | What happens | What to do |
|---|---|---|
Expecting |
404: the endpoint is not exposed by default (only |
Add |
|
Job data, including whatever was put there, is readable by anyone who can reach the actuator |
|
Believing a |
With |
The function matters only when values are shown |
Using the trigger-now |
Only |
Own secured endpoints for pause and delete; |
|
The application fails to start (measured: the properties are mutually exclusive) |
Migrate to |
Registering a listener as a bean |
Ignored: Boot collects no listeners |
|
A metric tag per job name or trigger name |
A new time series per dynamic job (one per loan); the metrics store is overloaded |
Tag with the group and the class |
A tag named |
Prometheus renames it to |
|
|
They describe this node only, even with a JDBC store |
Aggregate over instances in PromQL; use the QRTZ tables or the endpoint for cluster facts |
A listener that throws |
A |
|
A job-key MDC that is not cleared |
After a failed notification the key stays on the worker thread until the next job overwrites it (measured) |
Register the MDC listener first, clear it in both |
The Quartz health indicator on the liveness probe |
A database outage restarts every pod |
Readiness group only |
Alerting only on failures |
A stalled scheduler, a paused trigger group or a lost store produces no failure |
"Did not run" alerts on the success count, the last-success gauge and |
|
The default Prometheus retention (15 days) cannot cover a month |
|
The first misfire not counted |
A counter that first appears with the value 1 shows |
Pre-register counters for the known groups |
The |
One query per trigger on every refresh |
Cache it, or count with one |
|
A job deleted in between returns |
Null-check; the same window exists inside the endpoint |
JMX without authentication |
The MBean can pause, delete and shut the scheduler down |
Keep JMX local, or secure the remote port with authentication and TLS |
Every job execution is a root trace |
Quartz does not propagate the trace of the code that scheduled the job |
Store the scheduling request’s trace id in the |
Using |
On a JDBC store the result includes the pseudo group |
Skip it, or use the |
What changed
| Item | Spring Boot 3.5.16 | Spring Boot 4.1.1 |
|---|---|---|
Quartz endpoint class |
|
|
Endpoint auto-configuration and properties |
|
|
Listener registration customizer |
|
|
|
|
|
|
|
|
Access control of an endpoint |
|
Same key; |
|
Present, default |
Present, default |
Trigger-now |
Present (absent in 3.4.4 and 3.4.7, present in 3.5.5 and 3.5.16, checked with |
Present; only the state |
|
Since 3.5.0, |
Same package and API |
|
Spring Framework 6.1 and later, enabled by |
Enabled by |
Quartz health indicator, Quartz meters |
None (no class in the Actuator or auto-configuration jars) |
None |
Quartz version managed |
2.5.2 |
2.5.2 |
Spring Framework, Micrometer |
6.2.19, 1.15.12 |
7.0.9, 1.17.1 |
Compared with the older advice that circulates in articles: the Quartz endpoint is read-only up to Spring Boot 3.4 and has the trigger-now operation from 3.5; management.endpoint.<id>.enabled was replaced by access in 3.4 (and deprecated, not removed); health and security classes moved packages in Spring Boot 4; and the Quartz documentation’s configuration reference does not describe the JMX properties, which are in the source of StdSchedulerFactory. Nothing in Quartz 2.5.2 itself changed for this page compared with 2.4.x: the listener, scheduler-state and MBean interfaces used here are the same. Spring Boot 4.1 still ships no Quartz meters or health indicator, so the code on this page applies to both lines, with the import changes in the table.